Travelers 2007 Annual Report Download - page 83
Download and view the complete annual report
Please find page 83 of the 2007 Travelers annual report below. You can navigate through the pages in the report by either clicking on the pages listed below, or by using the keyword search tool below to find specific information within the annual report.-
 1
1 -
2
-
3
-
4
-
5
-
6
-
7
-
8
-
9
-
10
-
11
-
12
-
13
-
14
-
15
-
16
-
17
-
18
-
19
-
20
-
21
-
22
-
23
-
24
-
25
-
26
-
27
-
28
-
29
-
30
-
31
-
32
-
33
-
34
-
35
-
36
-
37
-
38
-
39
-
40
-
41
-
42
-
43
-
44
-
45
-
46
-
47
-
48
-
49
-
50
-
51
-
52
-
53
-
54
-
55
-
56
-
57
-
58
-
59
-
60
-
61
-
62
-
63
-
64
-
65
-
66
-
67
-
68
-
69
-
70
-
71
-
72
-
 73
73 -
 74
74 -
 75
75 -
 76
76 -
 77
77 -
 78
78 -
 79
79 -
 80
80 -
 81
81 -
 82
82 -
 83
83 -
 84
84 -
 85
85 -
 86
86 -
 87
87 -
 88
88 -
 89
89 -
 90
90 -
 91
91 -
 92
92 -
 93
93 -
94
-
95
-
96
-
97
-
98
-
99
-
100
-
101
-
102
-
103
-
104
-
105
-
106
-
107
-
108
-
109
-
110
-
111
-
112
-
113
-
114
-
115
-
116
-
117
-
118
-
119
-
120
-
121
-
122
-
123
-
124
-
125
-
126
-
127
-
128
-
129
-
130
-
131
-
132
-
133
-
134
-
135
-
136
-
137
-
138
-
139
-
140
-
141
-
142
-
143
-
144
-
145
-
146
-
147
-
148
-
149
-
150
-
151
-
152
-
153
-
154
-
155
-
156
-
157
-
158
-
159
-
160
-
161
-
162
-
163
-
164
-
165
-
166
-
167
-
168
-
169
-
170
-
171
-
172
-
173
-
174
-
175
-
176
-
177
-
178
-
179
-
180
-
181
-
182
-
183
-
184
-
185
-
186
-
187
-
188
-
189
-
190
-
191
-
192
-
193
-
194
-
195
-
196
-
197
-
198
-
199
-
200
-
201
-
202
-
203
-
204
-
205
-
206
-
207
-
208
-
209
-
210
-
211
-
212
-
213
-
214
-
215
-
216
-
217
-
218
-
219
-
220
-
221
-
222
-
223
-
224
-
225
-
226
-
227
-
228
-
229
-
230
-
231
-
232
-
233
-
234
-
235
-
236
-
237
-
238
-
239
-
240
-
241
-
242
-
243
-
244
-
245
-
246
-
247
-
248
-
249
-
250
-
251
-
252
-
253
-
254
-
255
-
256
-
257
-
258
-
259
-
260
-
261
-
262
-
263
-
264
-
265
-
266
-
267
-
268
-
269
-
270
-
271
-
272
-
273
-
274
-
275
-
276
-
277
-
278
-
279
-
280
 |
 |

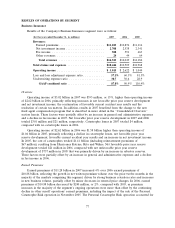
runoff and the sale of the Personal Catastrophe Risk operation in November 2005. Earned premiums
in the Financial, Professional & International Insurance segment in 2006 increased 4% over 2005,
primarily reflecting growth in Bond & Financial Products and the absence of catastrophe-related
reinstatement premiums. In the Personal Insurance segment, earned premium growth of 9% in 2006
reflected strong new business volume and continued renewal price increases.
Net Investment Income
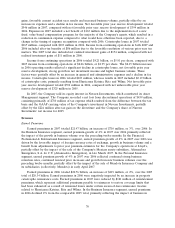
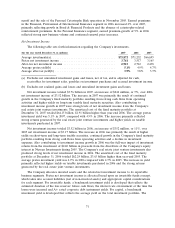
The following table sets forth information regarding the Company’s investments.
(for the year ended December 31, in millions) 2007 2006 2005
Average investments(a) ..................................... $73,872 $71,252 $66,695
Pretax net investment income ................................ 3,761 3,517 3,165
After-tax net investment income .............................. 2,915 2,712 2,438
Average pretax yield(b) .................................... 5.1% 4.9% 4.7%
Average after-tax yield(b) ................................... 3.9% 3.8% 3.7%
(a) Excludes net unrealized investment gains and losses, net of tax, and is adjusted for cash,
receivables for investment sales, payables on investment purchases and accrued investment income.
(b) Excludes net realized gains and losses and unrealized investment gains and losses.
Net investment income totaled $3.76 billion in 2007, an increase of $244 million, or 7%, over 2006
net investment income of $3.52 billion. The increase in 2007 was primarily the result of continued
growth in the Company’s fixed maturity portfolio resulting from strong cash flows from operating
activities and higher yields on long-term taxable fixed maturity securities. Also contributing to
investment income growth in 2007 were strong levels of net investment income from the Company’s
real estate joint venture investments. The amortized cost of the fixed maturity portfolio at
December 31, 2007 totaled $64.15 billion, $1.91 billion higher than year-end 2006. The average pretax
investment yield was 5.1% in 2007, compared with 4.9% in 2006. The increase primarily reflected
strong returns generated by the real estate joint venture investments and higher yields on taxable
investments purchased in 2007.
Net investment income totaled $3.52 billion in 2006, an increase of $352 million, or 11%, over
2005 net investment income of $3.17 billion. The increase in 2006 was primarily the result of higher
yields on short-term and long-term taxable securities, continued growth in the Company’s fixed maturity
portfolio resulting from strong cash flows from operating activities and a decline in investment
expenses. Also contributing to investment income growth in 2006 was the full-year impact of investment
returns from the investment of $2.40 billion in proceeds from the divestiture of the Company’s equity
interest in Nuveen Investments during 2005. The Company’s real estate joint venture investments also
produced strong levels of net investment income in 2006. The amortized cost of the fixed maturity
portfolio at December 31, 2006 totaled $62.24 billion, $3.63 billion higher than year-end 2005. The
average pretax investment yield was 4.9% in 2006 compared with 4.7% in 2005. The increase in yield
primarily reflected higher yields on taxable investments purchased in 2006 and the strong returns
generated by the real estate joint venture investments.
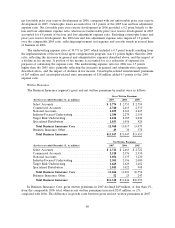
The Company allocates invested assets and the related net investment income to its reportable
business segments. Pretax net investment income is allocated based upon an investable funds concept,
which takes into account liabilities (net of non-invested assets) and appropriate capital considerations
for each segment. For investable funds, a benchmark investment yield is developed that reflects the
estimated duration of the loss reserves’ future cash flows, the interest rate environment at the time the
losses were incurred and A+ rated corporate debt instrument yields. For capital, a benchmark
investment yield is developed that reflects the average yield on the total investment portfolio. The
71