Travelers 2007 Annual Report Download - page 112
Download and view the complete annual report
Please find page 112 of the 2007 Travelers annual report below. You can navigate through the pages in the report by either clicking on the pages listed below, or by using the keyword search tool below to find specific information within the annual report.-
 1
1 -
2
-
3
-
4
-
5
-
6
-
7
-
8
-
9
-
10
-
11
-
12
-
13
-
14
-
15
-
16
-
17
-
18
-
19
-
20
-
21
-
22
-
23
-
24
-
25
-
26
-
27
-
28
-
29
-
30
-
31
-
32
-
33
-
34
-
35
-
36
-
37
-
38
-
39
-
40
-
41
-
42
-
43
-
44
-
45
-
46
-
47
-
48
-
49
-
50
-
51
-
52
-
53
-
54
-
55
-
56
-
57
-
58
-
59
-
60
-
61
-
62
-
63
-
64
-
65
-
66
-
67
-
68
-
69
-
70
-
71
-
72
-
73
-
74
-
75
-
76
-
77
-
78
-
79
-
80
-
81
-
82
-
83
-
84
-
85
-
86
-
87
-
88
-
89
-
90
-
91
-
92
-
93
-
94
-
95
-
96
-
97
-
98
-
99
-
100
-
101
-
 102
102 -
 103
103 -
 104
104 -
 105
105 -
 106
106 -
 107
107 -
 108
108 -
 109
109 -
 110
110 -
 111
111 -
 112
112 -
 113
113 -
 114
114 -
 115
115 -
 116
116 -
 117
117 -
 118
118 -
 119
119 -
 120
120 -
 121
121 -
 122
122 -
123
-
124
-
125
-
126
-
127
-
128
-
129
-
130
-
131
-
132
-
133
-
134
-
135
-
136
-
137
-
138
-
139
-
140
-
141
-
142
-
143
-
144
-
145
-
146
-
147
-
148
-
149
-
150
-
151
-
152
-
153
-
154
-
155
-
156
-
157
-
158
-
159
-
160
-
161
-
162
-
163
-
164
-
165
-
166
-
167
-
168
-
169
-
170
-
171
-
172
-
173
-
174
-
175
-
176
-
177
-
178
-
179
-
180
-
181
-
182
-
183
-
184
-
185
-
186
-
187
-
188
-
189
-
190
-
191
-
192
-
193
-
194
-
195
-
196
-
197
-
198
-
199
-
200
-
201
-
202
-
203
-
204
-
205
-
206
-
207
-
208
-
209
-
210
-
211
-
212
-
213
-
214
-
215
-
216
-
217
-
218
-
219
-
220
-
221
-
222
-
223
-
224
-
225
-
226
-
227
-
228
-
229
-
230
-
231
-
232
-
233
-
234
-
235
-
236
-
237
-
238
-
239
-
240
-
241
-
242
-
243
-
244
-
245
-
246
-
247
-
248
-
249
-
250
-
251
-
252
-
253
-
254
-
255
-
256
-
257
-
258
-
259
-
260
-
261
-
262
-
263
-
264
-
265
-
266
-
267
-
268
-
269
-
270
-
271
-
272
-
273
-
274
-
275
-
276
-
277
-
278
-
279
-
280
 |
 |

The Company’s real estate investments include warehouses and office buildings and other
commercial land and properties that are directly owned. The Company’s other investments primarily
comprise venture capital, through direct ownership and limited partnerships, private equity limited
partnerships, joint ventures, other limited partnerships and trading securities, which are subject to more
volatility than the Company’s fixed income investments, but historically have provided a higher return.
At December 31, 2007 and 2006, the carrying value of the Company’s other investments was
$3.37 billion and $3.40 billion, respectively. The Company does not believe it has a material exposure
to sub-prime mortgages within its other investments portfolio based on recent information provided by
the limited partnerships.
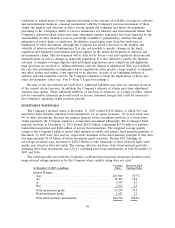
The net unrealized investment gains (losses) that were included as a separate component of
accumulated other changes in equity from nonowner sources were as follows:
(for the year ended December 31, in millions) 2007 2006 2005
Fixed maturities ................................... $768 $422 $367
Equity securities .................................. 15 37 41
Venture capital ................................... 17 108 89
Other investments (excluding venture capital) ............. 138 113 (12)
Unrealized investment gains before tax ................ 938 680 485
Provision for taxes ................................. 318 227 158
Net unrealized investment gains at end of year ........... $620 $453 $327
Net pretax unrealized investment gains at December 31, 2007 increased by $258 million over
year-end 2006, primarily driven by the fixed maturity portfolio. The increase in net unrealized
investment gains on fixed maturities was primarily driven by the impact of declining market interest
rates on both taxable and tax-exempt securities, which were partially offset by an increase in credit
spreads and a decrease in unrealized investment gains in the venture capital portfolio, primarily due to
sale activities. In May 2007, the Company completed a bundled sale of a substantial portion of its
venture capital portfolio, which resulted in the realization of $81 million of previously unrealized net
investment gains.
Net pretax unrealized investment gains at December 31, 2006 increased by $195 million over
year-end 2005, primarily concentrated in the fixed maturity portfolio and in other investments carried
at fair value. The increase in net unrealized investment gains on fixed maturities was primarily driven
by the impact of declining market interest rates on tax-exempt securities, which was partially offset by a
slight increase in market interest rates on taxable securities.
Impairment charges included in net realized investment gains were as follows:
(for the year ended December 31, in millions) 2007 2006 2005
Fixed maturities .................................... $37 $7 $11
Equity securities .................................... 74—
Real estate ........................................ 10 ——
Venture capital ..................................... 16 33 80
Other investments (excluding venture capital) ............... —418
Total ........................................... $70 $48 $109
100