Travelers 2007 Annual Report Download - page 89
Download and view the complete annual report
Please find page 89 of the 2007 Travelers annual report below. You can navigate through the pages in the report by either clicking on the pages listed below, or by using the keyword search tool below to find specific information within the annual report.-
 1
1 -
2
-
3
-
4
-
5
-
6
-
7
-
8
-
9
-
10
-
11
-
12
-
13
-
14
-
15
-
16
-
17
-
18
-
19
-
20
-
21
-
22
-
23
-
24
-
25
-
26
-
27
-
28
-
29
-
30
-
31
-
32
-
33
-
34
-
35
-
36
-
37
-
38
-
39
-
40
-
41
-
42
-
43
-
44
-
45
-
46
-
47
-
48
-
49
-
50
-
51
-
52
-
53
-
54
-
55
-
56
-
57
-
58
-
59
-
60
-
61
-
62
-
63
-
64
-
65
-
66
-
67
-
68
-
69
-
70
-
71
-
72
-
73
-
74
-
75
-
76
-
77
-
78
-
 79
79 -
 80
80 -
 81
81 -
 82
82 -
 83
83 -
 84
84 -
 85
85 -
 86
86 -
 87
87 -
 88
88 -
 89
89 -
 90
90 -
 91
91 -
 92
92 -
 93
93 -
 94
94 -
 95
95 -
 96
96 -
 97
97 -
 98
98 -
 99
99 -
100
-
101
-
102
-
103
-
104
-
105
-
106
-
107
-
108
-
109
-
110
-
111
-
112
-
113
-
114
-
115
-
116
-
117
-
118
-
119
-
120
-
121
-
122
-
123
-
124
-
125
-
126
-
127
-
128
-
129
-
130
-
131
-
132
-
133
-
134
-
135
-
136
-
137
-
138
-
139
-
140
-
141
-
142
-
143
-
144
-
145
-
146
-
147
-
148
-
149
-
150
-
151
-
152
-
153
-
154
-
155
-
156
-
157
-
158
-
159
-
160
-
161
-
162
-
163
-
164
-
165
-
166
-
167
-
168
-
169
-
170
-
171
-
172
-
173
-
174
-
175
-
176
-
177
-
178
-
179
-
180
-
181
-
182
-
183
-
184
-
185
-
186
-
187
-
188
-
189
-
190
-
191
-
192
-
193
-
194
-
195
-
196
-
197
-
198
-
199
-
200
-
201
-
202
-
203
-
204
-
205
-
206
-
207
-
208
-
209
-
210
-
211
-
212
-
213
-
214
-
215
-
216
-
217
-
218
-
219
-
220
-
221
-
222
-
223
-
224
-
225
-
226
-
227
-
228
-
229
-
230
-
231
-
232
-
233
-
234
-
235
-
236
-
237
-
238
-
239
-
240
-
241
-
242
-
243
-
244
-
245
-
246
-
247
-
248
-
249
-
250
-
251
-
252
-
253
-
254
-
255
-
256
-
257
-
258
-
259
-
260
-
261
-
262
-
263
-
264
-
265
-
266
-
267
-
268
-
269
-
270
-
271
-
272
-
273
-
274
-
275
-
276
-
277
-
278
-
279
-
280
 |
 |

RESULTS OF OPERATIONS BY SEGMENT
Business Insurance
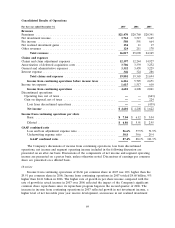
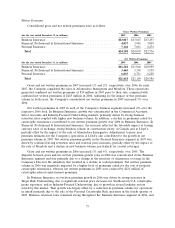
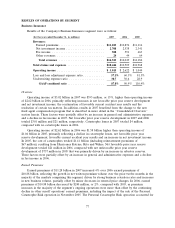
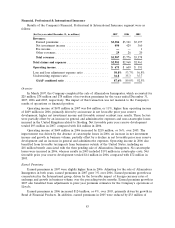
Results of the Company’s Business Insurance segment were as follows:
(for the year ended December 31, in millions) 2007 2006 2005
Revenues:
Earned premiums .......................... $11,283 $10,876 $11,116
Net investment income ...................... 2,708 2,538 2,341
Fee income .............................. 508 591 663
Other revenues ........................... 24 44 64
Total revenues .......................... $14,523 $14,049 $14,184
Total claims and expenses ..................... $10,444 $10,509 $12,968
Operating income ........................... $ 3,015 $ 2,622 $ 1,044
Loss and loss adjustment expense ratio ............ 57.1% 60.3% 81.5%
Underwriting expense ratio .................... 30.7 30.6 28.9
GAAP combined ratio ..................... 87.8% 90.9% 110.4%
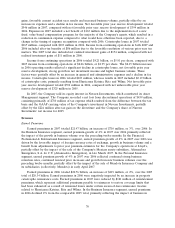
Overview
Operating income of $3.02 billion in 2007 was $393 million, or 15%, higher than operating income
of $2.62 billion in 2006, primarily reflecting increases in net favorable prior year reserve development
and net investment income, the continuation of favorable current accident year results and the
resolution of certain tax matters. In addition, results in 2007 benefited from the change to the new
fixed agent compensation program that is described in more detail in the ‘‘Consolidated Overview’’
section herein. These factors were partially offset by an increase in general and administrative expenses
and a decline in fee income in 2007. Net favorable prior year reserve development in 2007 and 2006
totaled $301 million and $21 million, respectively. Catastrophe losses in 2007 totaled $4 million,
compared with no catastrophe losses in 2006.
Operating income of $2.62 billion in 2006 was $1.58 billion higher than operating income of
$1.04 billion in 2005, primarily reflecting a decline in catastrophe losses, net favorable prior year
reserve development, favorable current accident year results and an increase in net investment income.
In 2005, the cost of catastrophes totaled $1.41 billion (including reinstatement premiums of
$67 million), resulting from Hurricanes Katrina, Rita and Wilma. Net favorable prior year reserve
development totaled $21 million in 2006, compared with net unfavorable prior year reserve
development of $757 million in 2005 that was primarily driven by an increase in asbestos reserves.
These factors were partially offset by an increase in general and administrative expenses and a decline
in fee income in 2006.
Earned Premiums
Earned premiums of $11.28 billion in 2007 increased 4% over 2006 earned premiums of
$10.88 billion, reflecting the growth in net written premium volume over the prior twelve months in the
majority of the markets comprising this segment, driven by strong business retention rates and increases
in new business volume, partially offset by minor decreases in renewal price changes. In 2006, earned
premiums of $10.88 billion decreased by $240 million, or 2%, compared with 2005, as premium
increases in the majority of the segment’s ongoing operations were more than offset by the continuing
decline in other runoff operations’ earned premiums, including the impact of the sale of the Personal
Catastrophe Risk operation in November 2005. The Personal Catastrophe Risk operation accounted for
77