Travelers 2007 Annual Report Download - page 84
Download and view the complete annual report
Please find page 84 of the 2007 Travelers annual report below. You can navigate through the pages in the report by either clicking on the pages listed below, or by using the keyword search tool below to find specific information within the annual report.-
 1
1 -
2
-
3
-
4
-
5
-
6
-
7
-
8
-
9
-
10
-
11
-
12
-
13
-
14
-
15
-
16
-
17
-
18
-
19
-
20
-
21
-
22
-
23
-
24
-
25
-
26
-
27
-
28
-
29
-
30
-
31
-
32
-
33
-
34
-
35
-
36
-
37
-
38
-
39
-
40
-
41
-
42
-
43
-
44
-
45
-
46
-
47
-
48
-
49
-
50
-
51
-
52
-
53
-
54
-
55
-
56
-
57
-
58
-
59
-
60
-
61
-
62
-
63
-
64
-
65
-
66
-
67
-
68
-
69
-
70
-
71
-
72
-
73
-
 74
74 -
 75
75 -
 76
76 -
 77
77 -
 78
78 -
 79
79 -
 80
80 -
 81
81 -
 82
82 -
 83
83 -
 84
84 -
 85
85 -
 86
86 -
 87
87 -
 88
88 -
 89
89 -
 90
90 -
 91
91 -
 92
92 -
 93
93 -
 94
94 -
95
-
96
-
97
-
98
-
99
-
100
-
101
-
102
-
103
-
104
-
105
-
106
-
107
-
108
-
109
-
110
-
111
-
112
-
113
-
114
-
115
-
116
-
117
-
118
-
119
-
120
-
121
-
122
-
123
-
124
-
125
-
126
-
127
-
128
-
129
-
130
-
131
-
132
-
133
-
134
-
135
-
136
-
137
-
138
-
139
-
140
-
141
-
142
-
143
-
144
-
145
-
146
-
147
-
148
-
149
-
150
-
151
-
152
-
153
-
154
-
155
-
156
-
157
-
158
-
159
-
160
-
161
-
162
-
163
-
164
-
165
-
166
-
167
-
168
-
169
-
170
-
171
-
172
-
173
-
174
-
175
-
176
-
177
-
178
-
179
-
180
-
181
-
182
-
183
-
184
-
185
-
186
-
187
-
188
-
189
-
190
-
191
-
192
-
193
-
194
-
195
-
196
-
197
-
198
-
199
-
200
-
201
-
202
-
203
-
204
-
205
-
206
-
207
-
208
-
209
-
210
-
211
-
212
-
213
-
214
-
215
-
216
-
217
-
218
-
219
-
220
-
221
-
222
-
223
-
224
-
225
-
226
-
227
-
228
-
229
-
230
-
231
-
232
-
233
-
234
-
235
-
236
-
237
-
238
-
239
-
240
-
241
-
242
-
243
-
244
-
245
-
246
-
247
-
248
-
249
-
250
-
251
-
252
-
253
-
254
-
255
-
256
-
257
-
258
-
259
-
260
-
261
-
262
-
263
-
264
-
265
-
266
-
267
-
268
-
269
-
270
-
271
-
272
-
273
-
274
-
275
-
276
-
277
-
278
-
279
-
280
 |
 |
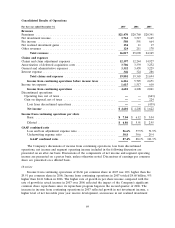
benchmark investment yields are applied to each segment’s investable funds and capital, respectively, to
produce a total notional investment income by segment. The Company’s actual net investment income
is allocated to each segment in proportion to the respective segment’s notional investment income to
total notional investment income.
Fee Income
The National Accounts market in the Business Insurance segment is the primary source of the
Company’s fee-based business. The declines in fee income in 2007 and 2006 compared with the
respective prior years is described in the Business Insurance segment discussion that follows.
Net Realized Investment Gains
Net realized investment gains in 2007 totaled $154 million, compared with net realized investment
gains of $11 million in 2006. The 2007 total included $91 million of net realized investment gains (net
of impairment losses of $16 million) generated by the venture capital portfolio (including an
$81 million net realized investment gain from the bundled sale of a substantial portion of the
Company’s venture capital investment holdings), $63 million of net realized investment gains from the
sale of a privately held security, $21 million of net realized investment gains related to the Company’s
holdings of stock purchase warrants of Platinum Underwriters Holdings, Ltd., a publicly-held company,
and $5 million of net realized investment gains (net of impairment losses of $37 million) from the
Company’s fixed maturity portfolio. These gains were partially offset by a net realized loss of
$24 million related to the divestiture of a subsidiary.
Net realized investment gains in 2006 totaled $11 million, compared with net realized investment
gains of $17 million in 2005. The 2006 total included $49 million of net realized investment gains (net
of impairment losses of $33 million) generated by the venture capital portfolio and $30 million of net
realized investment gains related to U.S. Treasury futures contracts (which require a daily
mark-to-market settlement and are used to shorten the duration of the Company’s fixed maturity
investment portfolio). These gains were substantially offset by $33 million of net realized investment
losses from the fixed maturity portfolio (including $7 million of impairment losses) and $22 million of
net realized investment losses related to the Company’s holdings of stock purchase warrants of
Platinum Underwriters Holdings, Ltd. In addition, the Company incurred net realized losses of
$11 million related to the divestiture of two small subsidiaries.
Net realized investment gains in 2005 were primarily generated from sales of venture capital
investments and equity securities. In addition, the Company realized a gain of $21 million from the sale
of its Personal Catastrophe Risk operation and $13 million of net gains related to U.S. Treasury futures
contracts. Net realized investment gains in 2005 were reduced by $109 million of impairment losses,
which were concentrated in the venture capital portfolio as described in more detail later in this
discussion.
Further information regarding the nature of impairment charges in each year is included in the
‘‘Investment Portfolio’’ section later in this discussion.
Other Revenues
Other revenues in all periods presented primarily consist of premium installment charges. In 2007,
other revenues also reflected a $39 million loss related to the Company’s redemption of its 4.50%
convertible junior subordinated notes in April 2007, consisting of the redemption premium paid and the
write-off of remaining debt issuance costs. Other revenues in 2006 included a $42 million gain on the
redemption of the Company’s $593 million, 7.60% subordinated debentures.
72