Travelers 2007 Annual Report Download - page 191
Download and view the complete annual report
Please find page 191 of the 2007 Travelers annual report below. You can navigate through the pages in the report by either clicking on the pages listed below, or by using the keyword search tool below to find specific information within the annual report.-
 1
1 -
2
-
3
-
4
-
5
-
6
-
7
-
8
-
9
-
10
-
11
-
12
-
13
-
14
-
15
-
16
-
17
-
18
-
19
-
20
-
21
-
22
-
23
-
24
-
25
-
26
-
27
-
28
-
29
-
30
-
31
-
32
-
33
-
34
-
35
-
36
-
37
-
38
-
39
-
40
-
41
-
42
-
43
-
44
-
45
-
46
-
47
-
48
-
49
-
50
-
51
-
52
-
53
-
54
-
55
-
56
-
57
-
58
-
59
-
60
-
61
-
62
-
63
-
64
-
65
-
66
-
67
-
68
-
69
-
70
-
71
-
72
-
73
-
74
-
75
-
76
-
77
-
78
-
79
-
80
-
81
-
82
-
83
-
84
-
85
-
86
-
87
-
88
-
89
-
90
-
91
-
92
-
93
-
94
-
95
-
96
-
97
-
98
-
99
-
100
-
101
-
102
-
103
-
104
-
105
-
106
-
107
-
108
-
109
-
110
-
111
-
112
-
113
-
114
-
115
-
116
-
117
-
118
-
119
-
120
-
121
-
122
-
123
-
124
-
125
-
126
-
127
-
128
-
129
-
130
-
131
-
132
-
133
-
134
-
135
-
136
-
137
-
138
-
139
-
140
-
141
-
142
-
143
-
144
-
145
-
146
-
147
-
148
-
149
-
150
-
151
-
152
-
153
-
154
-
155
-
156
-
157
-
158
-
159
-
160
-
161
-
162
-
163
-
164
-
165
-
166
-
167
-
168
-
169
-
170
-
171
-
172
-
173
-
174
-
175
-
176
-
177
-
178
-
179
-
180
-
 181
181 -
 182
182 -
 183
183 -
 184
184 -
 185
185 -
 186
186 -
 187
187 -
 188
188 -
 189
189 -
 190
190 -
 191
191 -
 192
192 -
 193
193 -
 194
194 -
 195
195 -
 196
196 -
 197
197 -
 198
198 -
 199
199 -
 200
200 -
 201
201 -
202
-
203
-
204
-
205
-
206
-
207
-
208
-
209
-
210
-
211
-
212
-
213
-
214
-
215
-
216
-
217
-
218
-
219
-
220
-
221
-
222
-
223
-
224
-
225
-
226
-
227
-
228
-
229
-
230
-
231
-
232
-
233
-
234
-
235
-
236
-
237
-
238
-
239
-
240
-
241
-
242
-
243
-
244
-
245
-
246
-
247
-
248
-
249
-
250
-
251
-
252
-
253
-
254
-
255
-
256
-
257
-
258
-
259
-
260
-
261
-
262
-
263
-
264
-
265
-
266
-
267
-
268
-
269
-
270
-
271
-
272
-
273
-
274
-
275
-
276
-
277
-
278
-
279
-
280
 |
 |

THE TRAVELERS COMPANIES, INC. AND SUBSIDIARIES
NOTES TO CONSOLIDATED FINANCIAL STATEMENTS (Continued)
3. INVESTMENTS (Continued)
Less than 12 months 12 months or longer Total
Gross Gross Gross
Fair Unrealized Fair Unrealized Fair Unrealized
(at December 31, 2006, in millions) Value Losses Value Losses Value Losses
Fixed maturities
U.S. Treasury securities and obligations
of U.S. Government and government
agencies and authorities .......... $ 1,014 $ 2 $ 964 $ 29 $ 1,978 $ 31
Obligations of states, municipalities
and political subdivisions ......... 4,468 16 4,077 64 8,545 80
Debt securities issued by foreign
governments .................. 861 6 406 4 1,267 10
Mortgage-backed securities,
collateralized mortgage obligations
and pass through securities ....... 1,245 11 4,125 117 5,370 128
All other corporate bonds .......... 3,690 36 6,325 211 10,015 247
Redeemable preferred stock ........ 1 — 5 1 6 1
Total fixed maturities ............ 11,279 71 15,902 426 27,181 497
Equity securities
Common stock .................. 3 — 1 — 4 —
Nonredeemable preferred stock ...... 50 1 53 4 103 5
Total equity securities ........... 53 1 54 4 107 5
Venture capital .................. — — 14 1 14 1
Total ....................... $11,332 $72 $15,970 $431 $27,302 $503
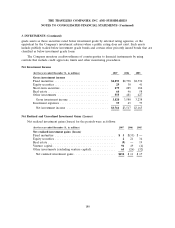
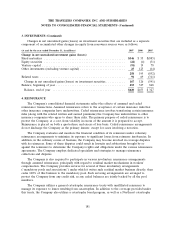
Impairment charges included in net realized investment gains were as follows:
(for the year ended December 31, in millions) 2007 2006 2005
Fixed maturities .................................... $37 $7 $11
Equity securities .................................... 74—
Real estate ........................................ 10 ——
Venture capital ..................................... 16 33 80
Other investments (excluding venture capital) ............... —418
Total ........................................... $70 $48 $109
Concentrations and Credit Quality
At December 31, 2007 and 2006, the Company had concentrations of credit risk in tax-exempt
investments of the state of Texas of $4.17 billion and $3.86 billion, respectively, of the state of
California of $2.27 billion and $2.10 billion, respectively, and of the state of Illinois of $2.11 billion and
$1.93 billion, respectively.
Included in fixed maturities are below investment grade assets totaling $1.64 billion and
$1.78 billion at December 31, 2007 and 2006, respectively. The Company defines its below investment
179