Travelers 2007 Annual Report Download - page 190
Download and view the complete annual report
Please find page 190 of the 2007 Travelers annual report below. You can navigate through the pages in the report by either clicking on the pages listed below, or by using the keyword search tool below to find specific information within the annual report.-
 1
1 -
2
-
3
-
4
-
5
-
6
-
7
-
8
-
9
-
10
-
11
-
12
-
13
-
14
-
15
-
16
-
17
-
18
-
19
-
20
-
21
-
22
-
23
-
24
-
25
-
26
-
27
-
28
-
29
-
30
-
31
-
32
-
33
-
34
-
35
-
36
-
37
-
38
-
39
-
40
-
41
-
42
-
43
-
44
-
45
-
46
-
47
-
48
-
49
-
50
-
51
-
52
-
53
-
54
-
55
-
56
-
57
-
58
-
59
-
60
-
61
-
62
-
63
-
64
-
65
-
66
-
67
-
68
-
69
-
70
-
71
-
72
-
73
-
74
-
75
-
76
-
77
-
78
-
79
-
80
-
81
-
82
-
83
-
84
-
85
-
86
-
87
-
88
-
89
-
90
-
91
-
92
-
93
-
94
-
95
-
96
-
97
-
98
-
99
-
100
-
101
-
102
-
103
-
104
-
105
-
106
-
107
-
108
-
109
-
110
-
111
-
112
-
113
-
114
-
115
-
116
-
117
-
118
-
119
-
120
-
121
-
122
-
123
-
124
-
125
-
126
-
127
-
128
-
129
-
130
-
131
-
132
-
133
-
134
-
135
-
136
-
137
-
138
-
139
-
140
-
141
-
142
-
143
-
144
-
145
-
146
-
147
-
148
-
149
-
150
-
151
-
152
-
153
-
154
-
155
-
156
-
157
-
158
-
159
-
160
-
161
-
162
-
163
-
164
-
165
-
166
-
167
-
168
-
169
-
170
-
171
-
172
-
173
-
174
-
175
-
176
-
177
-
178
-
179
-
 180
180 -
 181
181 -
 182
182 -
 183
183 -
 184
184 -
 185
185 -
 186
186 -
 187
187 -
 188
188 -
 189
189 -
 190
190 -
 191
191 -
 192
192 -
 193
193 -
 194
194 -
 195
195 -
 196
196 -
 197
197 -
 198
198 -
 199
199 -
 200
200 -
201
-
202
-
203
-
204
-
205
-
206
-
207
-
208
-
209
-
210
-
211
-
212
-
213
-
214
-
215
-
216
-
217
-
218
-
219
-
220
-
221
-
222
-
223
-
224
-
225
-
226
-
227
-
228
-
229
-
230
-
231
-
232
-
233
-
234
-
235
-
236
-
237
-
238
-
239
-
240
-
241
-
242
-
243
-
244
-
245
-
246
-
247
-
248
-
249
-
250
-
251
-
252
-
253
-
254
-
255
-
256
-
257
-
258
-
259
-
260
-
261
-
262
-
263
-
264
-
265
-
266
-
267
-
268
-
269
-
270
-
271
-
272
-
273
-
274
-
275
-
276
-
277
-
278
-
279
-
280
 |
 |

THE TRAVELERS COMPANIES, INC. AND SUBSIDIARIES
NOTES TO CONSOLIDATED FINANCIAL STATEMENTS (Continued)
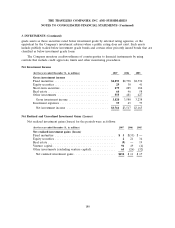
3. INVESTMENTS (Continued)
impact occurs, or a foreign tax adjustment is imposed on a pre-sale reporting period. The
maximum amount of this indemnification obligation is $193 million. The carrying value of this
obligation as of December 31, 2007 and 2006 was $59 million and $65 million, respectively. See
‘‘Guarantees’’ section of note 15.
The Company has other significant interests in variable interest entities that are not material.
The following securities are not consolidated:
• Mandatorily redeemable preferred securities of trusts holding solely the subordinated debentures
of the Company—These securities were issued by four separate trusts that were established for
the sole purpose of issuing the securities to investors, and are fully guaranteed by the Company.
The subordinated debt that the Company issued to these trusts is included in the ‘‘Debt’’ section
of liabilities on the Company’s consolidated balance sheet. That debt had a carrying value of
$310 million and $399 million at December 31, 2007 and 2006, respectively.
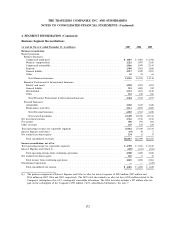
Unrealized Investment Losses
The following tables summarize, for all investments in an unrealized loss position at December 31,
2007 and 2006, the aggregate fair value and gross unrealized loss by length of time those securities
have been continuously in an unrealized loss position.
Less than 12 months 12 months or longer Total
Gross Gross Gross
Fair Unrealized Fair Unrealized Fair Unrealized
(at December 31, 2007, in millions) Value Losses Value Losses Value Losses
Fixed maturities
U.S. Treasury securities and obligations
of U.S. Government and government
agencies and authorities .......... $29$—$69$—$98$—
Obligations of states, municipalities and
political subdivisions ............. 3,428 23 2,044 17 5,472 40
Debt securities issued by foreign
governments ................... 409 1 384 4 793 5
Mortgage-backed securities,
collateralized mortgage obligations
and pass through securities ........ 838 5 3,118 60 3,956 65
All other corporate bonds ........... 2,646 55 5,797 139 8,443 194
Redeemable preferred stock ......... 19 1 8 1 27 2
Total fixed maturities ............ 7,369 85 11,420 221 18,789 306
Equity securities
Common stock ................... 29 1 — — 29 1
Nonredeemable preferred stock ...... 110 9 80 7 190 16
Total equity securities ............ 139 10 80 7 219 17
Venture capital .................. —— —— ——
Total ........................ $7,508 $95 $11,500 $228 $19,008 $323
178