Travelers 2007 Annual Report Download - page 114
Download and view the complete annual report
Please find page 114 of the 2007 Travelers annual report below. You can navigate through the pages in the report by either clicking on the pages listed below, or by using the keyword search tool below to find specific information within the annual report.-
 1
1 -
2
-
3
-
4
-
5
-
6
-
7
-
8
-
9
-
10
-
11
-
12
-
13
-
14
-
15
-
16
-
17
-
18
-
19
-
20
-
21
-
22
-
23
-
24
-
25
-
26
-
27
-
28
-
29
-
30
-
31
-
32
-
33
-
34
-
35
-
36
-
37
-
38
-
39
-
40
-
41
-
42
-
43
-
44
-
45
-
46
-
47
-
48
-
49
-
50
-
51
-
52
-
53
-
54
-
55
-
56
-
57
-
58
-
59
-
60
-
61
-
62
-
63
-
64
-
65
-
66
-
67
-
68
-
69
-
70
-
71
-
72
-
73
-
74
-
75
-
76
-
77
-
78
-
79
-
80
-
81
-
82
-
83
-
84
-
85
-
86
-
87
-
88
-
89
-
90
-
91
-
92
-
93
-
94
-
95
-
96
-
97
-
98
-
99
-
100
-
101
-
102
-
103
-
 104
104 -
 105
105 -
 106
106 -
 107
107 -
 108
108 -
 109
109 -
 110
110 -
 111
111 -
 112
112 -
 113
113 -
 114
114 -
 115
115 -
 116
116 -
 117
117 -
 118
118 -
 119
119 -
 120
120 -
 121
121 -
 122
122 -
 123
123 -
 124
124 -
125
-
126
-
127
-
128
-
129
-
130
-
131
-
132
-
133
-
134
-
135
-
136
-
137
-
138
-
139
-
140
-
141
-
142
-
143
-
144
-
145
-
146
-
147
-
148
-
149
-
150
-
151
-
152
-
153
-
154
-
155
-
156
-
157
-
158
-
159
-
160
-
161
-
162
-
163
-
164
-
165
-
166
-
167
-
168
-
169
-
170
-
171
-
172
-
173
-
174
-
175
-
176
-
177
-
178
-
179
-
180
-
181
-
182
-
183
-
184
-
185
-
186
-
187
-
188
-
189
-
190
-
191
-
192
-
193
-
194
-
195
-
196
-
197
-
198
-
199
-
200
-
201
-
202
-
203
-
204
-
205
-
206
-
207
-
208
-
209
-
210
-
211
-
212
-
213
-
214
-
215
-
216
-
217
-
218
-
219
-
220
-
221
-
222
-
223
-
224
-
225
-
226
-
227
-
228
-
229
-
230
-
231
-
232
-
233
-
234
-
235
-
236
-
237
-
238
-
239
-
240
-
241
-
242
-
243
-
244
-
245
-
246
-
247
-
248
-
249
-
250
-
251
-
252
-
253
-
254
-
255
-
256
-
257
-
258
-
259
-
260
-
261
-
262
-
263
-
264
-
265
-
266
-
267
-
268
-
269
-
270
-
271
-
272
-
273
-
274
-
275
-
276
-
277
-
278
-
279
-
280
 |
 |

current developments in the market that have the potential to affect the valuation of the Company’s
investments.
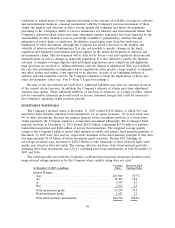
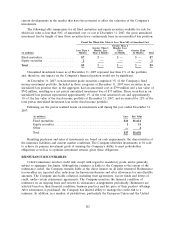
The following table summarizes for all fixed maturities and equity securities available for sale for
which fair value is less than 80% of amortized cost or cost at December 31, 2007, the gross unrealized
investment loss by length of time those securities have continuously been in an unrealized loss position:
Period For Which Fair Value Is Less Than 80% of Amortized Cost
Greater Than 6
Greater Than 3 Months, Less
Less Than 3 Months, Less Than Greater Than
(in millions) Months Than 6 Months 12 Months 12 Months Total
Fixed maturities .................. $7 $— $— $— $7
Equity securities ................. 2———2
Total .......................... $9 $— $— $— $9
Unrealized investment losses as of December 31, 2007 represent less than 1% of the portfolio,
and, therefore, any impact on the Company’s financial position would not be significant.
At December 31, 2007, non-investment grade securities comprised 3% of the Company’s fixed
income investment portfolio. Included in those categories at December 31, 2007 were securities in an
unrealized loss position that, in the aggregate, had an amortized cost of $799 million and a fair value of
$762 million, resulting in a net pretax unrealized investment loss of $37 million. These securities in an
unrealized loss position represented approximately 1% of the total amortized cost and approximately
1% of the fair value of the fixed income portfolio at December 31, 2007, and accounted for 12% of the
total pretax unrealized investment loss in the fixed income portfolio.
Following are the pretax realized losses on investments sold during the year ended December 31,
2007:
(in millions) Loss Fair Value
Fixed maturities ...................................... $34 $1,621
Equity securities ...................................... 131
Other .............................................. —4
Total .............................................. $35 $1,656
Resulting purchases and sales of investments are based on cash requirements, the characteristics of
the insurance liabilities and current market conditions. The Company identifies investments to be sold
to achieve its primary investment goals of assuring the Company’s ability to meet policyholder
obligations as well as to optimize investment returns, given these obligations.
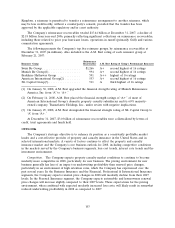
REINSURANCE RECOVERABLES
Ceded reinsurance involves credit risk, except with regard to mandatory pools, and is generally
subject to aggregate loss limits. Although the reinsurer is liable to the Company to the extent of the
reinsurance ceded, the Company remains liable as the direct insurer on all risks reinsured. Reinsurance
recoverables are reported after reductions for known insolvencies and after allowances for uncollectible
amounts. The Company also holds collateral, including trust agreements, escrow funds and letters of
credit, under certain reinsurance agreements. The Company monitors the financial condition of
reinsurers on an ongoing basis and reviews its reinsurance arrangements periodically. Reinsurers are
selected based on their financial condition, business practices and the price of their product offerings.
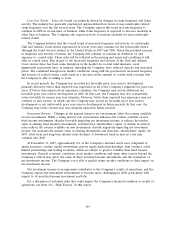
After reinsurance is purchased, the Company has limited ability to manage the credit risk to a
reinsurer. In addition, in a number of jurisdictions, particularly the European Union and the United
102