Travelers 2007 Annual Report Download - page 38
Download and view the complete annual report
Please find page 38 of the 2007 Travelers annual report below. You can navigate through the pages in the report by either clicking on the pages listed below, or by using the keyword search tool below to find specific information within the annual report.-
 1
1 -
2
-
3
-
4
-
5
-
6
-
7
-
8
-
9
-
10
-
11
-
12
-
13
-
14
-
15
-
16
-
17
-
18
-
19
-
20
-
21
-
22
-
23
-
24
-
25
-
26
-
27
-
 28
28 -
 29
29 -
 30
30 -
 31
31 -
 32
32 -
 33
33 -
 34
34 -
 35
35 -
 36
36 -
 37
37 -
 38
38 -
 39
39 -
 40
40 -
 41
41 -
 42
42 -
 43
43 -
 44
44 -
 45
45 -
 46
46 -
 47
47 -
 48
48 -
49
-
50
-
51
-
52
-
53
-
54
-
55
-
56
-
57
-
58
-
59
-
60
-
61
-
62
-
63
-
64
-
65
-
66
-
67
-
68
-
69
-
70
-
71
-
72
-
73
-
74
-
75
-
76
-
77
-
78
-
79
-
80
-
81
-
82
-
83
-
84
-
85
-
86
-
87
-
88
-
89
-
90
-
91
-
92
-
93
-
94
-
95
-
96
-
97
-
98
-
99
-
100
-
101
-
102
-
103
-
104
-
105
-
106
-
107
-
108
-
109
-
110
-
111
-
112
-
113
-
114
-
115
-
116
-
117
-
118
-
119
-
120
-
121
-
122
-
123
-
124
-
125
-
126
-
127
-
128
-
129
-
130
-
131
-
132
-
133
-
134
-
135
-
136
-
137
-
138
-
139
-
140
-
141
-
142
-
143
-
144
-
145
-
146
-
147
-
148
-
149
-
150
-
151
-
152
-
153
-
154
-
155
-
156
-
157
-
158
-
159
-
160
-
161
-
162
-
163
-
164
-
165
-
166
-
167
-
168
-
169
-
170
-
171
-
172
-
173
-
174
-
175
-
176
-
177
-
178
-
179
-
180
-
181
-
182
-
183
-
184
-
185
-
186
-
187
-
188
-
189
-
190
-
191
-
192
-
193
-
194
-
195
-
196
-
197
-
198
-
199
-
200
-
201
-
202
-
203
-
204
-
205
-
206
-
207
-
208
-
209
-
210
-
211
-
212
-
213
-
214
-
215
-
216
-
217
-
218
-
219
-
220
-
221
-
222
-
223
-
224
-
225
-
226
-
227
-
228
-
229
-
230
-
231
-
232
-
233
-
234
-
235
-
236
-
237
-
238
-
239
-
240
-
241
-
242
-
243
-
244
-
245
-
246
-
247
-
248
-
249
-
250
-
251
-
252
-
253
-
254
-
255
-
256
-
257
-
258
-
259
-
260
-
261
-
262
-
263
-
264
-
265
-
266
-
267
-
268
-
269
-
270
-
271
-
272
-
273
-
274
-
275
-
276
-
277
-
278
-
279
-
280
 |
 |

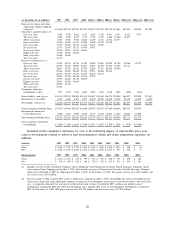
(at December 31, in millions) 1997 1998 1999 2000 2001(a) 2002(a) 2003(a) 2004(a) 2005(a)(b) 2006(a)(b) 2007(a)(b)
Reserves for claims and claim
adjustment expense originally
estimated ..............$21,406 $20,763 $19,983 $19,435 $20,197 $23,268 $24,055 $41,446 $42,895 $42,844 $43,098
Cumulative amounts paid as of
One year later ........... 4,025 4,159 4,082 4,374 5,018 5,170 4,651 8,871 8,632 7,417
Two years later .......... 6,882 6,879 6,957 7,517 8,745 8,319 8,686 14,666 13,837
Three years later ......... 8,850 9,006 9,324 10,218 11,149 11,312 11,541 18,733
Four years later .......... 10,480 10,809 11,493 12,000 13,402 13,548 13,708
Five years later .......... 11,915 12,565 12,911 13,603 15,115 15,229
Six years later ........... 13,376 13,647 14,172 14,958 16,473
Seven years later ......... 14,306 14,697 15,301 16,063
Eight years later ......... 15,225 15,681 16,206
Nine years later .......... 16,061 16,480
Ten years later ........... 16,753
Reserves reestimated as of
One year later ........... 21,083 20,521 19,736 19,394 23,228 23,658 24,222 41,706 42,466 42,172
Two years later .......... 20,697 20,172 19,600 22,233 24,083 24,592 25,272 42,565 42,311
Three years later ......... 20,417 19,975 22,302 22,778 25,062 25,553 26,042 42,940
Four years later .......... 20,168 22,489 22,612 23,871 25,953 26,288 26,501
Five years later .......... 22,570 22,593 23,591 24,872 26,670 26,731
Six years later ........... 22,625 23,492 24,559 25,521 27,179
Seven years later ......... 23,530 24,446 25,114 26,039
Eight years later ......... 24,425 24,908 25,664
Nine years later .......... 24,832 25,435
Ten years later ........... 25,321
Cumulative deficiency
(redundancy) (a)(b) ....... 3,915 4,672 5,681 6,604 6,982 3,463 2,446 1,494 (584) (672)
Gross liability—end of year ....$30,138 $29,411 $28,854 $28,312 $30,617 $33,628 $34,474 $58,984 $61,007 $59,202 $57,619
Reinsurance recoverables ..... 8,732 8,648 8,871 8,877 10,420 10,360 10,419 17,538 18,112 16,358 14,521
Net liability—end of year .....$21,406 $20,763 $19,983 $19,435 $20,197 $23,268 $24,055 $41,446 $42,895 $42,844 $43,098
Gross reestimated liability-latest . $34,227 $34,669 $35,659 $36,806 $39,552 $38,435 $37,464 $60,642 $60,535 $58,158
Reestimated reinsurance
recoverables-latest ........ 8,906 9,234 9,995 10,767 12,373 11,704 10,963 17,702 18,224 15,986
Net reestimated liability-latest . . . $25,321 $25,435 $25,664 $26,039 $27,179 $26,731 $26,501 $42,940 $42,311 $42,172
Gross cumulative deficiency
(redundancy) ...........$4,089 $ 5,258 $ 6,805 $ 8,494 $ 8,935 $ 4,807 $ 2,990 $ 1,658 $ (472) $(1,044)
Included in the cumulative deficiency by year is the following impact of unfavorable prior year
reserve development related to asbestos and environmental claims and claim adjustment expenses, in
millions:
Asbestos 1997 1998 1999 2000 2001 2002 2003 2004 2005 2006
Gross .................$6,062 $ 5,927 $ 5,799 $ 5,612 $ 5,329 $ 1,669 $ 1,644 $ 1,030 $ 196 $ (1)
Net...................$4,405 $ 4,339 $ 4,282 $ 4,232 $ 4,043 $ 1,098 $ 1,074 $ 987 $ 156 $ 0
Environmental 1997 1998 1999 2000 2001 2002 2003 2004 2005 2006
Gross .................$1,136 $ 1,013 $ 874 $ 799 $ 741 $ 587 $ 528 $ 307 $ 290 $ 182
Net...................$ 939$ 889$ 832$ 768$ 722$ 572$ 513 $ 335 $ 305 $ 185
(a) Includes reserves of The Northland Company and its subsidiaries and Commercial Guaranty Lloyds Insurance Company, which
were acquired from Citigroup on October 1, 2001. Also includes reserves of Commercial Guaranty Casualty Insurance Company,
which was contributed to TPC by Citigroup on October 3, 2001. At December 31, 2001, these gross reserves were $867 million, and
net reserves were $633 million.
(b) For years prior to 2004, excludes SPC reserves, which were acquired on April 1, 2004. Accordingly, the reserve development (net
reserves for claims and claim adjustment expenses reestimated as of subsequent years less net reserves recorded at the end of the
year, as originally estimated) for years prior to 2004 relates only to losses recorded by TPC and does not include reserve
development recorded by SPC. For 2004 and subsequent years, includes SPC reserves and subsequent development recorded by
SPC. At December 31, 2004, SPC gross reserves were $23,274 million, and net reserves were $15,959 million.
26