Target 2009 Annual Report Download - page 75
Download and view the complete annual report
Please find page 75 of the 2009 Target annual report below. You can navigate through the pages in the report by either clicking on the pages listed below, or by using the keyword search tool below to find specific information within the annual report.-
 1
1 -
2
-
3
-
4
-
5
-
6
-
7
-
8
-
9
-
10
-
11
-
12
-
13
-
14
-
15
-
16
-
17
-
18
-
19
-
20
-
21
-
22
-
23
-
24
-
25
-
26
-
27
-
28
-
29
-
30
-
31
-
32
-
33
-
34
-
35
-
36
-
37
-
38
-
39
-
40
-
41
-
42
-
43
-
44
-
45
-
46
-
47
-
48
-
49
-
50
-
51
-
52
-
53
-
54
-
55
-
56
-
57
-
58
-
59
-
60
-
61
-
62
-
63
-
64
-
 65
65 -
 66
66 -
 67
67 -
 68
68 -
 69
69 -
 70
70 -
 71
71 -
 72
72 -
 73
73 -
 74
74 -
 75
75 -
 76
76 -
 77
77 -
 78
78 -
 79
79 -
 80
80 -
 81
81 -
 82
82 -
 83
83 -
 84
84 -
 85
85 -
86
-
87
-
88
 |
 |

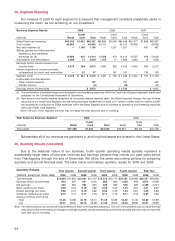
28. Segment Reporting
Our measure of profit for each segment is a measure that management considers analytically useful in
measuring the return we are achieving on our investment.
2009 2008 2007Business Segment Results
Credit Credit Credit
(millions) Retail Card Total Retail Card Total Retail Card Total
Sales/Credit card revenues $63,435 $1,922 $65,357 $62,884 $2,064 $64,948 $61,471 $1,896 $63,367
Cost of sales 44,062 — 44,062 44,157 — 44,157 42,929 — 42,929
Bad debt expense (a) — 1,185 1,185 — 1,251 1,251 — 481 481
Selling, general and administrative/
Operations and marketing
expenses (a) (b) 12,989 425 13,414 12,838 474 13,312 12,557 469 13,026
Depreciation and amortization 2,008 14 2,023 1,808 17 1,826 1,643 16 1,659
Earnings before interest expense and
income taxes 4,376 298 4,673 4,081 322 4,402 4,342 930 5,272
Interest expense on nonrecourse debt
collateralized by credit card receivables —9797— 167 167 — 133 133
Segment profit $ 4,376 $ 201 $ 4,576 $ 4,081 $ 155 $ 4,236 $ 4,342 $ 797 $ 5,139
Unallocated (income)/expense:
Other interest expense 707 727 535
Interest income (3) (28) (21)
Earnings before income taxes $ 3,872 $ 3,536 $ 4,625
(a) The combination of bad debt expense and operations and marketing expenses within the Credit Card Segment represent credit card
expenses on the Consolidated Statements of Operations.
(b) New account and loyalty rewards redeemed by our guests reduce reported sales. Our Retail Segment charges the cost of these
discounts to our Credit Card Segment, and the reimbursements of $89 million in 2009, $117 million in 2008, and $114 million in 2007
are recorded as a reduction to SG&A expenses within the Retail Segment and an increase to operations and marketing expenses
within the Credit Card Segment.
Note: The sum of the segment amounts may not equal the total amounts due to rounding.
2009 2008Total Assets by Business Segment
Credit Credit
(millions) Retail Card Total Retail Card Total
Total assets $37,200 $7,333 $44,533 $35,651 $8,455 $44,106
Substantially all of our revenues are generated in, and long-lived assets are located in, the United States.
29. Quarterly Results (Unaudited)
Due to the seasonal nature of our business, fourth quarter operating results typically represent a
substantially larger share of total year revenues and earnings because they include our peak sales period
from Thanksgiving through the end of December. We follow the same accounting policies for preparing
quarterly and annual financial data. The table below summarizes quarterly results for 2009 and 2008:
Quarterly Results First Quarter Second Quarter Third Quarter Fourth Quarter Total Year
(millions, except per share data) 2009 2008 2009 2008 2009 2008 2009 2008 2009 2008
Total revenues $14,833 $14,802 $15,067 $15,472 $15,276 $15,114 $20,181 $19,560 $65,357 $64,948
Earnings before income taxes 824 957 957 1,003 683 633 1,409 943 3,872 3,536
Net earnings 522 602 594 634 436 369 936 609 2,488 2,214
Basic earnings per share 0.69 0.75 0.79 0.82 0.58 0.49 1.25 0.81 3.31 2.87
Diluted earnings per share 0.69 0.74 0.79 0.82 0.58 0.49 1.24 0.81 3.30 2.86
Dividends declared per share 0.16 0.14 0.17 0.16 0.17 0.16 0.17 0.16 0.67 0.62
Closing common stock price
High 41.26 54.89 43.79 55.10 51.35 57.89 52.02 41.35 52.02 57.89
Low 25.37 48.50 36.75 43.68 41.38 32.69 45.30 26.96 25.37 26.96
Note: Per share amounts are computed independently for each of the quarters presented. The sum of the quarters may not equal the total
year amount due to the impact of changes in average quarterly shares outstanding and all other quarterly amounts may not equal the
total year due to rounding.
54