Target 2009 Annual Report Download - page 48
Download and view the complete annual report
Please find page 48 of the 2009 Target annual report below. You can navigate through the pages in the report by either clicking on the pages listed below, or by using the keyword search tool below to find specific information within the annual report.-
 1
1 -
2
-
3
-
4
-
5
-
6
-
7
-
8
-
9
-
10
-
11
-
12
-
13
-
14
-
15
-
16
-
17
-
18
-
19
-
20
-
21
-
22
-
23
-
24
-
25
-
26
-
27
-
28
-
29
-
30
-
31
-
32
-
33
-
34
-
35
-
36
-
37
-
 38
38 -
 39
39 -
 40
40 -
 41
41 -
 42
42 -
 43
43 -
 44
44 -
 45
45 -
 46
46 -
 47
47 -
 48
48 -
 49
49 -
 50
50 -
 51
51 -
 52
52 -
 53
53 -
 54
54 -
 55
55 -
 56
56 -
 57
57 -
 58
58 -
59
-
60
-
61
-
62
-
63
-
64
-
65
-
66
-
67
-
68
-
69
-
70
-
71
-
72
-
73
-
74
-
75
-
76
-
77
-
78
-
79
-
80
-
81
-
82
-
83
-
84
-
85
-
86
-
87
-
88
 |
 |

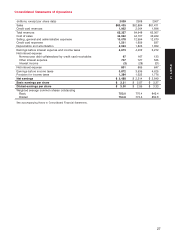
Consolidated Statements of Operations
(millions, except per share data) 2009 2008 2007
Sales $63,435 $62,884 $61,471
Credit card revenues 1,922 2,064 1,896
Total revenues 65,357 64,948 63,367
Cost of sales 44,062 44,157 42,929
Selling, general and administrative expenses 13,078 12,954 12,670
Credit card expenses 1,521 1,609 837
Depreciation and amortization 2,023 1,826 1,659
Earnings before interest expense and income taxes 4,673 4,402 5,272
Net interest expense
Nonrecourse debt collateralized by credit card receivables 97 167 133
Other interest expense 707 727 535
Interest income (3) (28) (21)
Net interest expense 801 866 647
Earnings before income taxes 3,872 3,536 4,625
Provision for income taxes 1,384 1,322 1,776
Net earnings $ 2,488 $ 2,214 $ 2,849
Basic earnings per share $ 3.31 $ 2.87 $ 3.37
Diluted earnings per share $ 3.30 $ 2.86 $ 3.33
Weighted average common shares outstanding
Basic 752.0 770.4 845.4
Diluted 754.8 773.6 850.8
See accompanying Notes to Consolidated Financial Statements.
27
PART II