Target 2009 Annual Report Download - page 70
Download and view the complete annual report
Please find page 70 of the 2009 Target annual report below. You can navigate through the pages in the report by either clicking on the pages listed below, or by using the keyword search tool below to find specific information within the annual report.-
 1
1 -
2
-
3
-
4
-
5
-
6
-
7
-
8
-
9
-
10
-
11
-
12
-
13
-
14
-
15
-
16
-
17
-
18
-
19
-
20
-
21
-
22
-
23
-
24
-
25
-
26
-
27
-
28
-
29
-
30
-
31
-
32
-
33
-
34
-
35
-
36
-
37
-
38
-
39
-
40
-
41
-
42
-
43
-
44
-
45
-
46
-
47
-
48
-
49
-
50
-
51
-
52
-
53
-
54
-
55
-
56
-
57
-
58
-
59
-
 60
60 -
 61
61 -
 62
62 -
 63
63 -
 64
64 -
 65
65 -
 66
66 -
 67
67 -
 68
68 -
 69
69 -
 70
70 -
 71
71 -
 72
72 -
 73
73 -
 74
74 -
 75
75 -
 76
76 -
 77
77 -
 78
78 -
 79
79 -
 80
80 -
81
-
82
-
83
-
84
-
85
-
86
-
87
-
88
 |
 |

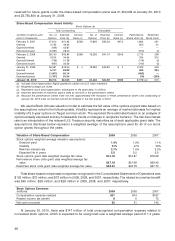
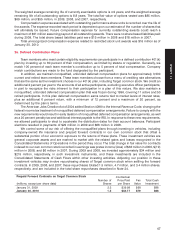
Pension Benefits
Change in Plan Assets Postretirement Health
Qualified Plans Nonqualified Plans Care Benefits
(millions) 2009 2008 2009 2008 2009 2008
Fair value of plan assets at
beginning of measurement
period $1,771 $2,192 $— $— $— $—
Actual return on plan assets 232 (430) ————
Employer contributions 252 103 3412 13
Participant contributions 1———66
Benefits paid (99) (94) (3) (4) (18) (19)
Fair value of plan assets at end of
measurement period 2,157 1,771 ————
Benefit obligation at end of
measurement period 2,227 1,948 33 36 87 117
Funded status $ (70) $ (177) $(33) $(36) $(87) $(117)
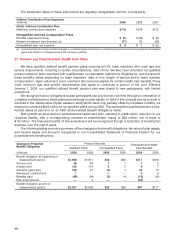
Amounts recognized in the Consolidated Statements of Financial Position consist of the following:
Qualified Plans Nonqualified Plans (a)
Recognition of Funded/(Underfunded) Status
(millions) 2009 2008 2009 2008
Other noncurrent assets $2 $1 $— $—
Accrued and other current liabilities (1) (1) (13) (13)
Other noncurrent liabilities (71) (177) (107) (140)
Net amounts recognized $(70) $(177) $(120) $(153)
(a) Includes postretirement health care benefits.
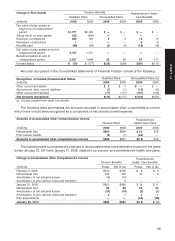
The following table summarizes the amounts recorded in accumulated other comprehensive income,
which have not yet been recognized as a component of net periodic benefit expense:
Amounts in Accumulated Other Comprehensive Income Postretirement
Pension Plans Health Care Plans
(millions) 2009 2008 2009 2008
Net actuarial loss $900 $828 $50 $19
Prior service credits (5) (7) (62) —
Amounts in accumulated other comprehensive income $895 $821 $(12) $19
The following table summarizes the changes in accumulated other comprehensive income for the years
ended January 30, 2010 and January 31, 2009, related to our pension and postretirement health care plans:
Change in Accumulated Other Comprehensive Income Postretirement
Pension Benefits Health Care Benefits
(millions) Pretax Net of tax Pretax Net of tax
February 2, 2008 $212 $129 $ 9 $ 5
Net actuarial loss 618 376 10 6
Amortization of net actuarial losses (16) (10) — —
Amortization of prior service costs and transition 7 4 — —
January 31, 2009 $821 $499 $ 19 $ 11
Net actuarial loss 96 58 33 20
Amortization of net actuarial losses (24) (14) (2) (1)
Amortization of prior service costs and transition 2121
Plan amendments — — (64) (38)
January 30, 2010 $895 $544 $(12) $ (7)
49
PART II