Target 2009 Annual Report Download - page 34
Download and view the complete annual report
Please find page 34 of the 2009 Target annual report below. You can navigate through the pages in the report by either clicking on the pages listed below, or by using the keyword search tool below to find specific information within the annual report.-
 1
1 -
2
-
3
-
4
-
5
-
6
-
7
-
8
-
9
-
10
-
11
-
12
-
13
-
14
-
15
-
16
-
17
-
18
-
19
-
20
-
21
-
22
-
23
-
 24
24 -
 25
25 -
 26
26 -
 27
27 -
 28
28 -
 29
29 -
 30
30 -
 31
31 -
 32
32 -
 33
33 -
 34
34 -
 35
35 -
 36
36 -
 37
37 -
 38
38 -
 39
39 -
 40
40 -
 41
41 -
 42
42 -
 43
43 -
 44
44 -
45
-
46
-
47
-
48
-
49
-
50
-
51
-
52
-
53
-
54
-
55
-
56
-
57
-
58
-
59
-
60
-
61
-
62
-
63
-
64
-
65
-
66
-
67
-
68
-
69
-
70
-
71
-
72
-
73
-
74
-
75
-
76
-
77
-
78
-
79
-
80
-
81
-
82
-
83
-
84
-
85
-
86
-
87
-
88
 |
 |

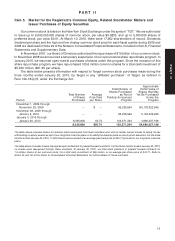
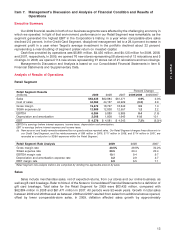
Item 7. Management’s Discussion and Analysis of Financial Condition and Results of
Operations
Executive Summary
Our 2009 financial results in both of our business segments were affected by the challenging economy in
which we operated. In light of that environment, performance in our Retail Segment was remarkable, as the
segment generated the highest EBIT in the Corporation’s history, in a year when comparable-store sales
declined 2.5 percent. In the Credit Card Segment, disciplined management led to a 29.4 percent increase in
segment profit in a year when Target’s average investment in the portfolio declined about 32 percent,
representing a near-doubling of segment pretax return on invested capital.
Cash flow provided by operations was $5,881 million, $4,430 million, and $4,125 million for 2009, 2008,
and 2007, respectively. In 2009, we opened 76 new stores representing 58 stores net of 13 relocations and 5
closings. In 2008, we opened 114 new stores representing 91 stores net of 21 relocations and two closings.
Management’s Discussion and Analysis is based on our Consolidated Financial Statements in Item 8,
Financial Statements and Supplementary Data.
Analysis of Results of Operations
Retail Segment
Percent Change
Retail Segment Results
(millions) 2009 2008 2007 2009/2008 2008/2007
Sales $63,435 $62,884 $61,471 0.9% 2.3%
Cost of sales 44,062 44,157 42,929 (0.2) 2.9
Gross margin 19,373 18,727 18,542 3.5 1.0
SG&A expenses (a) 12,989 12,838 12,557 1.2 2.2
EBITDA 6,384 5,889 5,985 8.4 (1.6)
Depreciation and amortization 2,008 1,808 1,643 11.0 10.1
EBIT $ 4,376 $ 4,081 $ 4,342 7.3% (6.0)%
EBITDA is earnings before interest expense, income taxes, depreciation and amortization.
EBIT is earnings before interest expense and income taxes.
(a) New account and loyalty rewards redeemed by our guests reduce reported sales. Our Retail Segment charges these discounts to
our Credit Card Segment, and the reimbursements of $89 million in 2009, $117 million in 2008, and $114 million in 2007, are
recorded as a reduction to SG&A expenses within the Retail Segment.
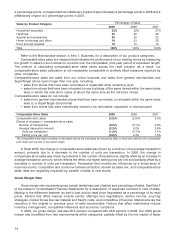
Retail Segment Rate Analysis 2009 2008 2007
Gross margin rate 30.5% 29.8% 30.2%
SG&A expense rate 20.5 20.4 20.4
EBITDA margin rate 10.1 9.4 9.7
Depreciation and amortization expense rate 3.2 2.9 2.7
EBIT margin rate 6.9 6.5 7.1
Retail Segment rate analysis metrics are computed by dividing the applicable amount by sales.
Sales
Sales include merchandise sales, net of expected returns, from our stores and our online business, as
well as gift card breakage. Refer to Note 2 of the Notes to Consolidated Financial Statements for a definition of
gift card breakage. Total sales for the Retail Segment for 2009 were $63,435 million, compared with
$62,884 million in 2008 and $61,471 million in 2007. All periods were 52-week years. Growth in total sales
between 2009 and 2008 as well as between 2008 and 2007 resulted from sales from additional stores opened,
offset by lower comparable-store sales. In 2009, deflation affected sales growth by approximately
13
PART II