Target 2009 Annual Report Download - page 58
Download and view the complete annual report
Please find page 58 of the 2009 Target annual report below. You can navigate through the pages in the report by either clicking on the pages listed below, or by using the keyword search tool below to find specific information within the annual report.-
 1
1 -
2
-
3
-
4
-
5
-
6
-
7
-
8
-
9
-
10
-
11
-
12
-
13
-
14
-
15
-
16
-
17
-
18
-
19
-
20
-
21
-
22
-
23
-
24
-
25
-
26
-
27
-
28
-
29
-
30
-
31
-
32
-
33
-
34
-
35
-
36
-
37
-
38
-
39
-
40
-
41
-
42
-
43
-
44
-
45
-
46
-
47
-
 48
48 -
 49
49 -
 50
50 -
 51
51 -
 52
52 -
 53
53 -
 54
54 -
 55
55 -
 56
56 -
 57
57 -
 58
58 -
 59
59 -
 60
60 -
 61
61 -
 62
62 -
 63
63 -
 64
64 -
 65
65 -
 66
66 -
 67
67 -
 68
68 -
69
-
70
-
71
-
72
-
73
-
74
-
75
-
76
-
77
-
78
-
79
-
80
-
81
-
82
-
83
-
84
-
85
-
86
-
87
-
88
 |
 |

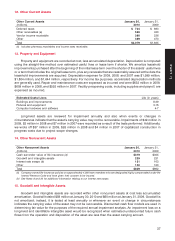
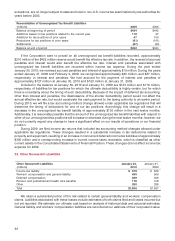
12. Other Current Assets
Other Current Assets January 30, January 31,
(millions) 2010 2009
Deferred taxes $ 724 $ 693
Other receivables (a) 526 433
Vendor income receivable 390 236
Other 439 473
Total $2,079 $1,835
(a) Includes pharmacy receivables and income taxes receivable.
13. Property and Equipment
Property and equipment are recorded at cost, less accumulated depreciation. Depreciation is computed
using the straight-line method over estimated useful lives or lease term if shorter. We amortize leasehold
improvements purchased after the beginning of the initial lease term over the shorter of the assets’ useful lives
or a term that includes the original lease term, plus any renewals that are reasonably assured at the date the
leasehold improvements are acquired. Depreciation expense for 2009, 2008, and 2007 was $1,999 million,
$1,804 million, and $1,644 million, respectively. For income tax purposes, accelerated depreciation methods
are generally used. Repair and maintenance costs are expensed as incurred and were $632 million in 2009,
$609 million in 2008, and $592 million in 2007. Facility preopening costs, including supplies and payroll, are
expensed as incurred.
Estimated Useful Lives Life (in years)
Buildings and improvements 8-39
Fixtures and equipment 3-15
Computer hardware and software 4-7
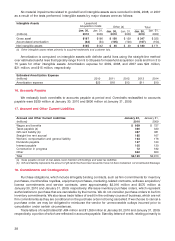
Long-lived assets are reviewed for impairment annually and also when events or changes in
circumstances indicate that the asset’s carrying value may not be recoverable. Impairments of $49 million in
2009, $2 million in 2008 and $7 million in 2007 were recorded as a result of the tests performed. Additionally,
we wrote off $37 million in 2009, $26 million in 2008 and $4 million in 2007 of capitalized construction in
progress costs due to project scope changes.
14. Other Noncurrent Assets
Other Noncurrent Assets January 30, January 31,
(millions) 2010 2009
Cash surrender value of life insurance (a) $319 $305
Goodwill and intangible assets 239 231
Interest rate swaps (b) 131 163
Other 140 163
Total $829 $862
(a) Company-owned life insurance policies on approximately 4,000 team members who are designated highly compensated under the
Internal Revenue Code and have given their consent to be insured.
(b) See Notes 8 and 20 for additional information relating to our interest rate swaps.
15. Goodwill and Intangible Assets
Goodwill and intangible assets are recorded within other noncurrent assets at cost less accumulated
amortization. Goodwill totaled $59 million at January 30, 2010 and $60 million at January 31, 2009. Goodwill is
not amortized; instead, it is tested at least annually or whenever an event or change in circumstances
indicates the carrying value of the asset may not be recoverable. Discounted cash flow models are used in
determining fair value for the purposes of the required annual impairment analysis. An impairment loss on a
long-lived and identifiable intangible asset would be recognized when estimated undiscounted future cash
flows from the operation and disposition of the asset are less than the asset carrying amount.
37
PART II