Target 2009 Annual Report Download - page 49
Download and view the complete annual report
Please find page 49 of the 2009 Target annual report below. You can navigate through the pages in the report by either clicking on the pages listed below, or by using the keyword search tool below to find specific information within the annual report.-
 1
1 -
2
-
3
-
4
-
5
-
6
-
7
-
8
-
9
-
10
-
11
-
12
-
13
-
14
-
15
-
16
-
17
-
18
-
19
-
20
-
21
-
22
-
23
-
24
-
25
-
26
-
27
-
28
-
29
-
30
-
31
-
32
-
33
-
34
-
35
-
36
-
37
-
38
-
 39
39 -
 40
40 -
 41
41 -
 42
42 -
 43
43 -
 44
44 -
 45
45 -
 46
46 -
 47
47 -
 48
48 -
 49
49 -
 50
50 -
 51
51 -
 52
52 -
 53
53 -
 54
54 -
 55
55 -
 56
56 -
 57
57 -
 58
58 -
 59
59 -
60
-
61
-
62
-
63
-
64
-
65
-
66
-
67
-
68
-
69
-
70
-
71
-
72
-
73
-
74
-
75
-
76
-
77
-
78
-
79
-
80
-
81
-
82
-
83
-
84
-
85
-
86
-
87
-
88
 |
 |

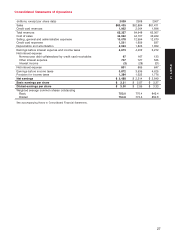
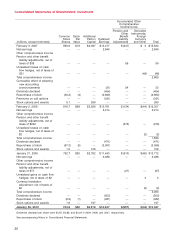
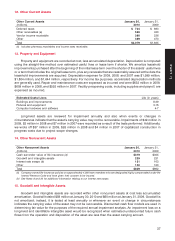
Consolidated Statements of Financial Position
January 30, January 31,
(millions, except footnotes) 2010 2009
Assets
Cash and cash equivalents, including marketable securities of $1,617 and $302 $ 2,200 $ 864
Credit card receivables, net of allowance of $1,016 and $1,010 6,966 8,084
Inventory 7,179 6,705
Other current assets 2,079 1,835
Total current assets 18,424 17,488
Property and equipment
Land 5,793 5,767
Buildings and improvements 22,152 20,430
Fixtures and equipment 4,743 4,270
Computer hardware and software 2,575 2,586
Construction-in-progress 502 1,763
Accumulated depreciation (10,485) (9,060)
Property and equipment, net 25,280 25,756
Other noncurrent assets 829 862
Total assets $44,533 $44,106
Liabilities and shareholders’ investment
Accounts payable $ 6,511 $ 6,337
Accrued and other current liabilities 3,120 2,913
Unsecured debt and other borrowings 796 1,262
Nonrecourse debt collateralized by credit card receivables 900 —
Total current liabilities 11,327 10,512
Unsecured debt and other borrowings 10,643 12,000
Nonrecourse debt collateralized by credit card receivables 4,475 5,490
Deferred income taxes 835 455
Other noncurrent liabilities 1,906 1,937
Total noncurrent liabilities 17,859 19,882
Shareholders’ investment
Common stock 62 63
Additional paid-in-capital 2,919 2,762
Retained earnings 12,947 11,443
Accumulated other comprehensive loss (581) (556)
Total shareholders’ investment 15,347 13,712
Total liabilities and shareholders’ investment $44,533 $44,106
Common Stock Authorized 6,000,000,000 shares, $0.0833 par value; 744,644,454 shares issued and outstanding at January 30,
2010; 752,712,464 shares issued and outstanding at January 31, 2009.
Preferred Stock Authorized 5,000,000 shares, $0.01 par value; no shares were issued or outstanding at January 30, 2010 or
January 31, 2009.
See accompanying Notes to Consolidated Financial Statements.
28