Target 2009 Annual Report Download - page 54
Download and view the complete annual report
Please find page 54 of the 2009 Target annual report below. You can navigate through the pages in the report by either clicking on the pages listed below, or by using the keyword search tool below to find specific information within the annual report.-
 1
1 -
2
-
3
-
4
-
5
-
6
-
7
-
8
-
9
-
10
-
11
-
12
-
13
-
14
-
15
-
16
-
17
-
18
-
19
-
20
-
21
-
22
-
23
-
24
-
25
-
26
-
27
-
28
-
29
-
30
-
31
-
32
-
33
-
34
-
35
-
36
-
37
-
38
-
39
-
40
-
41
-
42
-
43
-
 44
44 -
 45
45 -
 46
46 -
 47
47 -
 48
48 -
 49
49 -
 50
50 -
 51
51 -
 52
52 -
 53
53 -
 54
54 -
 55
55 -
 56
56 -
 57
57 -
 58
58 -
 59
59 -
 60
60 -
 61
61 -
 62
62 -
 63
63 -
 64
64 -
65
-
66
-
67
-
68
-
69
-
70
-
71
-
72
-
73
-
74
-
75
-
76
-
77
-
78
-
79
-
80
-
81
-
82
-
83
-
84
-
85
-
86
-
87
-
88
 |
 |

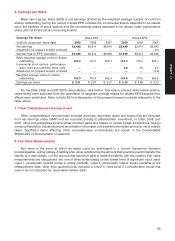
6. Earnings per Share
Basic earnings per share (EPS) is net earnings divided by the weighted average number of common
shares outstanding during the period. Diluted EPS includes the incremental shares assumed to be issued
upon the exercise of stock options and the incremental shares assumed to be issued under performance
share and restricted stock unit arrangements.
Earnings Per Share Basic EPS Diluted EPS
(millions, except per share data) 2009 2008 2007 2009 2008 2007
Net earnings $2,488 $2,214 $2,849 $2,488 $2,214 $2,849
Adjustment for prepaid forward contracts ————— (11)
Net earnings for EPS calculation $2,488 $2,214 $2,849 $2,488 $2,214 $2,838
Basic weighted average common shares
outstanding 752.0 770.4 845.4 752.0 770.4 845.4
Incremental stock options, performance
share units and restricted stock units ———2.8 3.2 6.0
Adjustment for prepaid forward contracts ————— (0.6)
Weighted average common shares
outstanding 752.0 770.4 845.4 754.8 773.6 850.8
Earnings per share $ 3.31 $ 2.87 $ 3.37 $ 3.30 $ 2.86 $ 3.33
For the 2009, 2008, and 2007 EPS computations, 16.8 million, 10.5 million, and 6.3 million stock options,
respectively, were excluded from the calculation of weighted average shares for diluted EPS because their
effects were antidilutive. Refer to Note 26 for a description of the prepaid forward contracts referred to in the
table above.
7. Other Comprehensive Income/(Loss)
Other comprehensive income/(loss) includes revenues, expenses, gains and losses that are excluded
from net earnings under GAAP and are recorded directly to shareholders’ investment. In 2009, 2008, and
2007, other comprehensive income/(loss) included gains and losses on certain hedge transactions, foreign
currency translation adjustments and amortization of pension and postretirement plan amounts, net of related
taxes. Significant items affecting other comprehensive income/(loss) are shown in the Consolidated
Statements of Shareholders’ Investment.
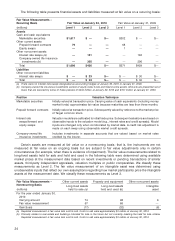
8. Fair Value Measurements
Fair value is the price at which an asset could be exchanged in a current transaction between
knowledgeable, willing parties. A liability’s fair value is defined as the amount that would be paid to transfer the
liability to a new obligor, not the amount that would be paid to settle the liability with the creditor. Fair value
measurements are categorized into one of three levels based on the lowest level of significant input used:
Level 1 (unadjusted quoted prices in active markets); Level 2 (observable market inputs available at the
measurement date, other than quoted prices included in Level 1); and Level 3 (unobservable inputs that
cannot be corroborated by observable market data).
33
PART II