Target 2009 Annual Report Download - page 39
Download and view the complete annual report
Please find page 39 of the 2009 Target annual report below. You can navigate through the pages in the report by either clicking on the pages listed below, or by using the keyword search tool below to find specific information within the annual report.-
 1
1 -
2
-
3
-
4
-
5
-
6
-
7
-
8
-
9
-
10
-
11
-
12
-
13
-
14
-
15
-
16
-
17
-
18
-
19
-
20
-
21
-
22
-
23
-
24
-
25
-
26
-
27
-
28
-
 29
29 -
 30
30 -
 31
31 -
 32
32 -
 33
33 -
 34
34 -
 35
35 -
 36
36 -
 37
37 -
 38
38 -
 39
39 -
 40
40 -
 41
41 -
 42
42 -
 43
43 -
 44
44 -
 45
45 -
 46
46 -
 47
47 -
 48
48 -
 49
49 -
50
-
51
-
52
-
53
-
54
-
55
-
56
-
57
-
58
-
59
-
60
-
61
-
62
-
63
-
64
-
65
-
66
-
67
-
68
-
69
-
70
-
71
-
72
-
73
-
74
-
75
-
76
-
77
-
78
-
79
-
80
-
81
-
82
-
83
-
84
-
85
-
86
-
87
-
88
 |
 |
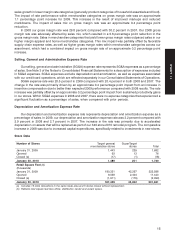
Our 2009 period-end gross credit card receivables were $7,982 million compared with $9,094 million in
2008, a decrease of 12.2 percent. Average gross credit card receivables in 2009 decreased 4.0 percent
compared with 2008 levels. This change was driven by tighter risk management and underwriting initiatives
that have significantly reduced available credit lines for higher-risk cardholders, fewer new accounts being
opened, and a decrease in charge activity resulting from reductions in card usage by our guests, partially
offset by the impact of a decline in payment rates.
Our 2008 period-end gross credit card receivables were $9,094 million compared with $8,624 million in
2007, an increase of 5.4 percent. Average gross credit card receivables in 2008 increased 19.5 percent
compared with 2007 levels. This growth was driven by the annualization of the prior year’s product change
from proprietary Target Cards to higher-limit Target Visa cards and the impact of industry-wide declines in
payment rates, offset in part by a reduction in charge activity resulting from reductions in card usage by our
guests, and from risk management and underwriting initiatives that significantly reduced credit lines for higher
risk cardholders.
Other Performance Factors
Net Interest Expense
Net interest expense was $801 million at the end of 2009, decreasing 7.5 percent, or $65 million from
2008. This decline was due to a decrease in the annualized average portfolio interest rate from 5.3 percent to
4.8 percent partially offset by a $16 million charge related to the early retirement of long-term debt. In 2008, net
interest expense was $866 million compared with $647 million in 2007, an increase of 33.8 percent. This
increase was due primarily to higher average debt balances supporting capital investment, share repurchase
and the receivables portfolio, partially offset by a lower average portfolio net interest rate.
Provision for Income Taxes
Our effective income tax rate was 35.7 percent in 2009 and 37.4 percent in 2008. The decrease in the
effective rate between periods is primarily due to nontaxable capital market returns on investments used to
economically hedge the market risk in deferred compensation plans in 2009 compared with nondeductible
losses in 2008. The 2009 effective income tax rate is also lower due to federal and state discrete items.
Our effective income tax rate for 2008 was 37.4 percent compared with 38.4 percent in 2007. The
decrease in 2008 was primarily due to tax reserve reductions resulting from audit settlements and the effective
resolution of other issues. The 2008 effective income tax rate was also lower due to a comparatively greater
proportion of earnings subject to rate differences between taxing jurisdictions. These rate declines were
partially offset by lower capital market returns on investments used to economically hedge the market risk in
deferred compensation plans. Gains and losses from these investments are not taxable.
Analysis of Financial Condition
Liquidity and Capital Resources
Our 2009 operations were entirely funded by internally generated funds. Cash flow provided by
operations was $5,881 in 2009 compared with $4,430 million in 2008. This strong cash flow allowed us to fund
capital expenditures of $1,729 million and pay off $1.3 billion of maturing debt with internally generated funds.
In addition we accelerated the payoff of a $550 million 2010 debt maturity, restarted our share repurchase
program earlier than expected and experienced a $1.3 billion increase in marketable securities at January 30,
2010.
Our 2009 period-end gross credit card receivables were $7,982 million compared with $9,094 million in
2008, a decrease of 12.2 percent. Average gross credit card receivables in 2009 decreased 4.0 percent
compared with 2008 levels. This change was driven by the factors indicated in the Credit Card Segment
above. This trend and the factors influencing it are likely to continue into 2010. Due to the decrease in gross
credit card receivables, Target Receivables Corporation (TRC), using cash flows from the receivables, repaid
an affiliate of JPMorgan Chase (JPMC) $163 million during 2009 under the terms of our agreement with them
as described in Note 10 of the Notes to Consolidated Financial Statements. To the extent the receivables
balance continues to decline, TRC expects to continue to pay JPMC a prorata portion of principal collections
such that the portion owned by JPMC would not exceed 47 percent.
18