Target 2009 Annual Report Download - page 71
Download and view the complete annual report
Please find page 71 of the 2009 Target annual report below. You can navigate through the pages in the report by either clicking on the pages listed below, or by using the keyword search tool below to find specific information within the annual report.-
 1
1 -
2
-
3
-
4
-
5
-
6
-
7
-
8
-
9
-
10
-
11
-
12
-
13
-
14
-
15
-
16
-
17
-
18
-
19
-
20
-
21
-
22
-
23
-
24
-
25
-
26
-
27
-
28
-
29
-
30
-
31
-
32
-
33
-
34
-
35
-
36
-
37
-
38
-
39
-
40
-
41
-
42
-
43
-
44
-
45
-
46
-
47
-
48
-
49
-
50
-
51
-
52
-
53
-
54
-
55
-
56
-
57
-
58
-
59
-
60
-
 61
61 -
 62
62 -
 63
63 -
 64
64 -
 65
65 -
 66
66 -
 67
67 -
 68
68 -
 69
69 -
 70
70 -
 71
71 -
 72
72 -
 73
73 -
 74
74 -
 75
75 -
 76
76 -
 77
77 -
 78
78 -
 79
79 -
 80
80 -
 81
81 -
82
-
83
-
84
-
85
-
86
-
87
-
88
 |
 |

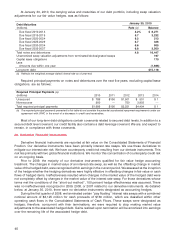
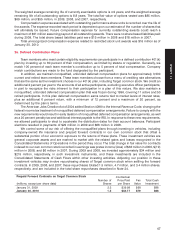
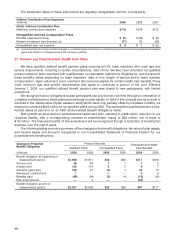
The following table summarizes the amounts in accumulated other comprehensive income expected to
be amortized and recognized as a component of net periodic benefit expense in 2010:
Expected Amortization of Amounts in Accumulated Other Comprehensive Income
(millions) Pretax Net of tax
Net actuarial loss $49 $30
Prior service credits (13) (8)
Total amortization expense $ 36 $22
The following table summarizes our net pension and postretirement health care benefits expense for the
years 2009, 2008, and 2007:
Net Pension and Postretirement Pension Benefits Postretirement Health Care Benefits
Health Care Benefits Expense
(millions) 2009 2008 2007 2009 2008 2007
Service cost benefits earned
during the period $ 100 $94 $97 $7 $5 $4
Interest cost on projected benefit
obligation 125 116 105 677
Expected return on assets (177) (162) (152) ———
Amortization of losses 24 16 38 2—1
Amortization of prior service cost (2) (4) (4) (2) ——
Total $ 70 $60 $84 $13 $12 $12
Prior service cost amortization is determined using the straight-line method over the average remaining
service period of team members expected to receive benefits under the plan.
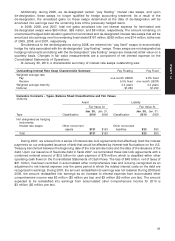
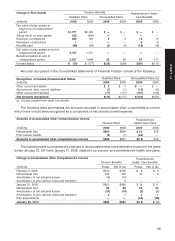
Defined Benefit Pension Plan Information
(millions) 2009 2008
Accumulated benefit obligation (ABO) for all plans (a) $2,118 $1,812
Projected benefit obligation for pension plans with an ABO in excess of plan
assets (b) 48 1,979
Total ABO for pension plans with an ABO in excess of plan assets 42 1,808
Fair value of plan assets for pension plans with an ABO in excess of plan assets —1,765
(a) The present value of benefits earned to date assuming no future salary growth.
(b) The present value of benefits earned to date by plan participants, including the effect of assumed future salary increases.
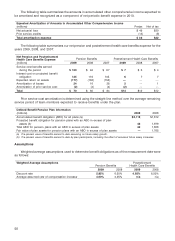
Assumptions
Weighted average assumptions used to determine benefit obligations as of the measurement date were
as follows:
PostretirementWeighted Average Assumptions
Pension Benefits Health Care Benefits
2009 2008 2009 2008
Discount rate 5.85% 6.50% 4.85% 6.50%
Average assumed rate of compensation increase 4.00% 4.25% n/a n/a
50