Target 2009 Annual Report Download - page 36
Download and view the complete annual report
Please find page 36 of the 2009 Target annual report below. You can navigate through the pages in the report by either clicking on the pages listed below, or by using the keyword search tool below to find specific information within the annual report.-
 1
1 -
2
-
3
-
4
-
5
-
6
-
7
-
8
-
9
-
10
-
11
-
12
-
13
-
14
-
15
-
16
-
17
-
18
-
19
-
20
-
21
-
22
-
23
-
24
-
25
-
 26
26 -
 27
27 -
 28
28 -
 29
29 -
 30
30 -
 31
31 -
 32
32 -
 33
33 -
 34
34 -
 35
35 -
 36
36 -
 37
37 -
 38
38 -
 39
39 -
 40
40 -
 41
41 -
 42
42 -
 43
43 -
 44
44 -
 45
45 -
 46
46 -
47
-
48
-
49
-
50
-
51
-
52
-
53
-
54
-
55
-
56
-
57
-
58
-
59
-
60
-
61
-
62
-
63
-
64
-
65
-
66
-
67
-
68
-
69
-
70
-
71
-
72
-
73
-
74
-
75
-
76
-
77
-
78
-
79
-
80
-
81
-
82
-
83
-
84
-
85
-
86
-
87
-
88
 |
 |

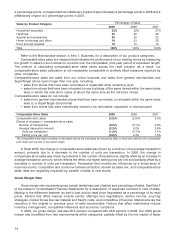
sales growth in lower margin rate categories (generally product categories of household essentials and food).
The impact of rate performance within merchandise categories on gross margin rate was an approximate
1.1 percentage point increase for 2009. This increase is the result of improved markups and reduced
markdowns. The impact of sales mix on gross margin rate was an approximate 0.4 percentage point
reduction.
In 2008 our gross margin rate was 29.8 percent compared with 30.2 percent in 2007. Our 2008 gross
margin rate was adversely affected by sales mix, which resulted in a 0.6 percentage point reduction in the
gross margin rate. Sales in merchandise categories that yield lower gross margin rates outpaced sales in our
higher margin apparel and home merchandise categories. This mix impact was partially offset by favorable
supply chain expense rates, as well as higher gross margin rates within merchandise categories across our
assortment, which had a combined impact on gross margin rate of an approximate 0.2 percentage point
increase.
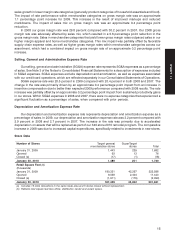
Selling, General and Administrative Expense Rate
Our selling, general and administrative (SG&A) expense rate represents SG&A expenses as a percentage
of sales. See Note 3 of the Notes to Consolidated Financial Statements for a description of expenses included
in SG&A expenses. SG&A expenses exclude depreciation and amortization, as well as expenses associated
with our credit card operations, which are reflected separately in our Consolidated Statements of Operations.
SG&A expense rate was 20.5 percent in 2009 compared with 20.4 percent in both 2008 and 2007. The
change in the rate was primarily driven by an approximate 0.4 percentage point impact from an increase in
incentive compensation due to better than expected 2009 performance compared with 2008 results. The rate
increase was partially offset by an approximate 0.2 percentage point impact from sustained productivity gains
in our stores. Within SG&A expenses in 2008 and 2007, there were no expense categories that experienced a
significant fluctuation as a percentage of sales, when compared with prior periods.
Depreciation and Amortization Expense Rate
Our depreciation and amortization expense rate represents depreciation and amortization expense as a
percentage of sales. In 2009, our depreciation and amortization expense rate was 3.2 percent compared with
2.9 percent in 2008 and 2.7 percent in 2007. The increase in the rate was primarily due to accelerated
depreciation on assets that will be replaced as part of our 340-store 2010 remodel program. The comparative
increase in 2008 was due to increased capital expenditures, specifically related to investments in new stores.
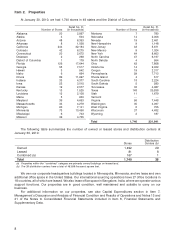
Store Data
Number of Stores Target general SuperTarget
merchandise stores stores Total
January 31, 2009 1,443 239 1,682
Opened 63 13 76
Closed (a) (17) (1) (18)
January 30, 2010 1,489 251 1,740
Retail Square Feet (b)
(thousands)
January 31, 2009 180,321 42,267 222,588
Opened 9,039 2,404 11,443
Closed (a) (1,911) (179) (2,090)
January 30, 2010 187,449 44,492 231,941
(a) Includes 13 store relocations in the same trade area and 5 stores closed without replacement.
(b) Reflects total square feet less office, distribution center and vacant space.
15
PART II