Target 2009 Annual Report Download - page 40
Download and view the complete annual report
Please find page 40 of the 2009 Target annual report below. You can navigate through the pages in the report by either clicking on the pages listed below, or by using the keyword search tool below to find specific information within the annual report.-
 1
1 -
2
-
3
-
4
-
5
-
6
-
7
-
8
-
9
-
10
-
11
-
12
-
13
-
14
-
15
-
16
-
17
-
18
-
19
-
20
-
21
-
22
-
23
-
24
-
25
-
26
-
27
-
28
-
29
-
 30
30 -
 31
31 -
 32
32 -
 33
33 -
 34
34 -
 35
35 -
 36
36 -
 37
37 -
 38
38 -
 39
39 -
 40
40 -
 41
41 -
 42
42 -
 43
43 -
 44
44 -
 45
45 -
 46
46 -
 47
47 -
 48
48 -
 49
49 -
 50
50 -
51
-
52
-
53
-
54
-
55
-
56
-
57
-
58
-
59
-
60
-
61
-
62
-
63
-
64
-
65
-
66
-
67
-
68
-
69
-
70
-
71
-
72
-
73
-
74
-
75
-
76
-
77
-
78
-
79
-
80
-
81
-
82
-
83
-
84
-
85
-
86
-
87
-
88
 |
 |

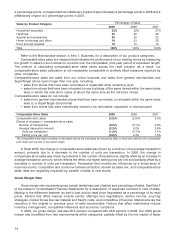
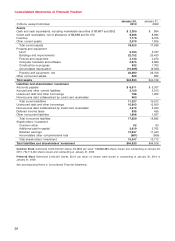
Year-end inventory levels increased $474 million, or 7.1 percent from 2008, primarily due to unusually low
inventory levels at the end of 2008 in response to the challenging economic environment. Inventory levels
were also higher to support traffic-driving strategic initiatives, such as food and pharmacy, in addition to
comparatively higher retail square footage. Accounts payable increased by $174 million, or 2.7 percent over
the same period.
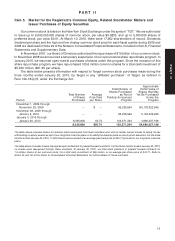
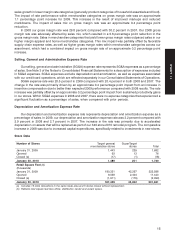
During 2009, we repurchased 9.9 million shares of our common stock for a total cash investment of
$479 million ($48.54 per share) under a $10 billion share repurchase plan authorized by our Board of Directors
in November 2007. In 2008, we repurchased 67.2 million shares of our common stock for a total cash
investment of $3,395 million ($50.49 per share).
We paid dividends totaling $496 million in 2009 and $465 million in 2008, an increase of 6.7 percent. We
declared dividends totaling $503 million ($0.67 per share) in 2009, an increase of 6.8 percent over 2008. In
2008, we declared dividends totaling $471 million ($0.62 per share), an increase of 3.8 percent over 2007. We
have paid dividends every quarter since our first dividend was declared following our 1967 initial public
offering, and it is our intent to continue to do so in the future.
Our financing strategy is to ensure liquidity and access to capital markets, to manage our net exposure to
floating interest rate volatility, and to maintain a balanced spectrum of debt maturities. Within these
parameters, we seek to minimize our borrowing costs.
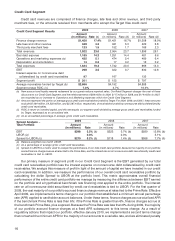
Maintaining strong investment-grade debt ratings is a key part of our financing strategy. Our current debt
ratings are as follows:
Standard andDebt Ratings
Moody’s Poor’s Fitch
Long-term debt A2 A+ A
Commercial paper P-1 A-1 F1
Securitized receivables (a) Aa2 A+ n/a
(a) These rated securitized receivables exclude the interest in our credit card receivables sold to JPMC.
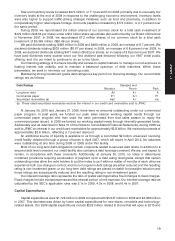
At January 30, 2010 and January 31, 2009, there were no amounts outstanding under our commercial
paper program. In past years, we funded our peak sales season working capital needs through our
commercial paper program and then used the cash generated from that sales season to repay the
commercial paper issued. In 2009 we funded our working capital needs through internally generated funds.
Additionally and as described in Note 10 of the Notes to Consolidated Financial Statements, during 2008 we
sold to JPMC an interest in our credit card receivables for approximately $3.8 billion. We received proceeds of
approximately $3.6 billion, reflecting a 7 percent discount.
An additional source of liquidity is available to us through a committed $2 billion unsecured revolving
credit facility obtained through a group of banks in April 2007, which will expire in April 2012. No balances
were outstanding at any time during 2009 or 2008 under this facility.
Most of our long-term debt obligations contain covenants related to secured debt levels. In addition to a
secured debt level covenant, our credit facility also contains a debt leverage covenant. We are, and expect to
remain, in compliance with these covenants. Additionally, at January 30, 2010, no notes or debentures
contained provisions requiring acceleration of payment upon a debt rating downgrade, except that certain
outstanding notes allow the note holders to put the notes to us if within a matter of months of each other we
experience both (i) a change in control; and (ii) our long-term debt ratings are either reduced and the resulting
rating is non-investment grade, or our long-term debt ratings are placed on watch for possible reduction and
those ratings are subsequently reduced and the resulting rating is non-investment grade.
Our interest coverage ratio represents the ratio of pretax earnings before fixed charges to fixed charges.
Fixed charges include interest expense and the interest portion of rent expense. Our interest coverage ratio as
calculated by the SEC’s applicable rules was 5.1x in 2009, 4.3x in 2008, and 6.4x in 2007.
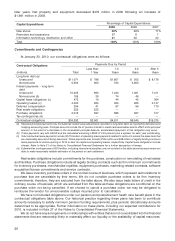
Capital Expenditures
Capital expenditures were $1,729 million in 2009 compared with $3,547 million in 2008 and $4,369 million
in 2007. This decrease was driven by lower capital expenditures for new stores, remodels and technology-
related assets. Our 2009 capital expenditures include $232 million related to stores that will open in 2010 and
19
PART II