Target 2009 Annual Report Download - page 35
Download and view the complete annual report
Please find page 35 of the 2009 Target annual report below. You can navigate through the pages in the report by either clicking on the pages listed below, or by using the keyword search tool below to find specific information within the annual report.-
 1
1 -
2
-
3
-
4
-
5
-
6
-
7
-
8
-
9
-
10
-
11
-
12
-
13
-
14
-
15
-
16
-
17
-
18
-
19
-
20
-
21
-
22
-
23
-
24
-
 25
25 -
 26
26 -
 27
27 -
 28
28 -
 29
29 -
 30
30 -
 31
31 -
 32
32 -
 33
33 -
 34
34 -
 35
35 -
 36
36 -
 37
37 -
 38
38 -
 39
39 -
 40
40 -
 41
41 -
 42
42 -
 43
43 -
 44
44 -
 45
45 -
46
-
47
-
48
-
49
-
50
-
51
-
52
-
53
-
54
-
55
-
56
-
57
-
58
-
59
-
60
-
61
-
62
-
63
-
64
-
65
-
66
-
67
-
68
-
69
-
70
-
71
-
72
-
73
-
74
-
75
-
76
-
77
-
78
-
79
-
80
-
81
-
82
-
83
-
84
-
85
-
86
-
87
-
88
 |
 |

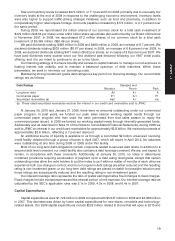
4 percentage points, compared with an inflationary impact of approximately 2 percentage points in 2008 and a
deflationary impact of 2 percentage points in 2007.
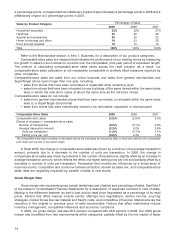
Percentage of Sales
Sales by Product Category
2009 2008 2007
Household essentials 23% 22% 21%
Hardlines 22 22 22
Apparel and accessories 20 20 22
Home furnishings and d´
ecor 19 21 22
Food and pet supplies 16 15 13
Total 100% 100% 100%
Refer to the Merchandise section in Item 1, Business, for a description of our product categories.
Comparable-store sales is a measure that indicates the performance of our existing stores by measuring
the growth in sales for such stores for a period over the comparable, prior-year period of equivalent length.
The method of calculating comparable-store sales varies across the retail industry. As a result, our
comparable-store sales calculation is not necessarily comparable to similarly titled measures reported by
other companies.
Comparable-store sales are sales from our online business and sales from general merchandise and
SuperTarget stores open longer than one year, including:
• sales from stores that have been remodeled or expanded while remaining open
• sales from stores that have been relocated to new buildings of the same format within the same trade
area, in which the new store opens at about the same time as the old store closes
Comparable-store sales do not include:
• sales from general merchandise stores that have been converted, or relocated within the same trade
area, to a SuperTarget store format
• sales from stores that were intentionally closed to be remodeled, expanded or reconstructed
Comparable-Store Sales 2009 2008 2007
Comparable-store sales (2.5)% (2.9)% 3.0%
Drivers of changes in comparable-store sales:
Number of transactions (0.2)% (3.1)% 0.3%
Average transaction amount (2.3)% 0.2% 2.6%
Units per transaction (1.5)% (2.1)% 1.1%
Selling price per unit (0.8)% 2.3% 1.5%
The comparable-store sales increases or decreases above are calculated by comparing sales in fiscal year periods with comparable
prior fiscal year periods of equivalent length.
In fiscal 2009, the change in comparable-store sales was driven by a decline in the average transaction
amount, primarily due to a decrease in the number of units per transaction. In 2008, the change in
comparable-store sales was driven by a decline in the number of transactions, slightly offset by an increase in
average transaction amount, which reflects the effect of a higher selling price per unit sold partially offset by a
decrease in number of units per transaction. Transaction-level metrics are influenced by a broad array of
macroeconomic, competitive and consumer behavioral factors, as well as sales mix, and comparable-store
sales rates are negatively impacted by transfer of sales to new stores.
Gross Margin Rate
Gross margin rate represents gross margin (sales less cost of sales) as a percentage of sales. See Note 3
of the Notes to Consolidated Financial Statements for a description of expenses included in cost of sales.
Markup is the difference between an item’s cost and its retail price (expressed as a percentage of its retail
price). Factors that affect markup include vendor offerings and negotiations, vendor income, sourcing
strategies, market forces like raw material and freight costs, and competitive influences. Markdowns are the
reduction in the original or previous price of retail merchandise. Factors that affect markdowns include
inventory management, competitive influences and economic conditions.
In 2009, our gross margin rate was 30.5 percent compared with 29.8 percent in 2008. Our 2009 gross
margin rate benefitted from rate improvements within categories, partially offset by the mix impact of faster
14