Target 2009 Annual Report Download - page 37
Download and view the complete annual report
Please find page 37 of the 2009 Target annual report below. You can navigate through the pages in the report by either clicking on the pages listed below, or by using the keyword search tool below to find specific information within the annual report.-
 1
1 -
2
-
3
-
4
-
5
-
6
-
7
-
8
-
9
-
10
-
11
-
12
-
13
-
14
-
15
-
16
-
17
-
18
-
19
-
20
-
21
-
22
-
23
-
24
-
25
-
26
-
 27
27 -
 28
28 -
 29
29 -
 30
30 -
 31
31 -
 32
32 -
 33
33 -
 34
34 -
 35
35 -
 36
36 -
 37
37 -
 38
38 -
 39
39 -
 40
40 -
 41
41 -
 42
42 -
 43
43 -
 44
44 -
 45
45 -
 46
46 -
 47
47 -
48
-
49
-
50
-
51
-
52
-
53
-
54
-
55
-
56
-
57
-
58
-
59
-
60
-
61
-
62
-
63
-
64
-
65
-
66
-
67
-
68
-
69
-
70
-
71
-
72
-
73
-
74
-
75
-
76
-
77
-
78
-
79
-
80
-
81
-
82
-
83
-
84
-
85
-
86
-
87
-
88
 |
 |

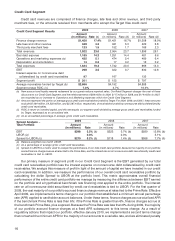
Credit Card Segment
Credit card revenues are comprised of finance charges, late fees and other revenue, and third party
merchant fees, or the amounts received from merchants who accept the Target Visa credit card.
2009 2008 2007
Credit Card Segment Results
Amount Amount Amount
(in millions) Rate (d) (in millions) Rate (d) (in millions) Rate (d)
Finance charge revenue $1,450 17.4% $1,451 16.7% $1,308 18.0%
Late fees and other revenue 349 4.2 461 5.3 422 5.8
Third party merchant fees 123 1.5 152 1.7 166 2.3
Total revenues 1,922 23.0 2,064 23.7 1,896 26.1
Bad debt expense 1,185 14.2 1,251 14.4 481 6.6
Operations and marketing expenses (a) 425 5.1 474 5.4 469 6.4
Depreciation and amortization 14 0.2 17 0.2 16 0.2
Total expenses 1,624 19.4 1,742 20.0 966 13.3
EBIT 298 3.5 322 3.7 930 12.8
Interest expense on nonrecourse debt
collateralized by credit card receivables 97 167 133
Segment profit $ 201 $ 155 $ 797
Average receivables funded by Target (b) $2,866 $4,192 $4,888
Segment pretax ROIC (c) 7.0% 3.7% 16.3%
(a) New account and loyalty rewards redeemed by our guests reduce reported sales. Our Retail Segment charges the cost of these
discounts to our Credit Card Segment, and the reimbursements of $89 million in 2009, $117 million in 2008, and $114 million in 2007,
are recorded as an increase to Operations and Marketing expenses within the Credit Card Segment.
(b) Amounts represent the portion of average gross credit card receivables funded by Target. For 2009, 2008, and 2007, these amounts
exclude $5,484 million, $4,503 million, and $2,387 million, respectively, of receivables funded by nonrecourse debt collateralized by
credit card receivables.
(c) ROIC is return on invested capital, and this rate equals our segment profit divided by average gross credit card receivables funded
by Target, expressed as an annualized rate.
(d) As an annualized percentage of average gross credit card receivables.
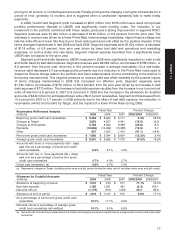
2009 2008 2007
Spread Analysis –
Total Portfolio Amount Amount Amount
(in millions) Rate (in millions) Rate (in millions) Rate
EBIT $298 3.5% (b) $322 3.7% (b) $930 12.8% (b)
LIBOR (a) 0.3% 2.3% 5.1%
Spread to LIBOR (c) $270 3.2% (b) $118 1.4% (b) $558 7.7% (b)
(a) Balance-weighted one-month LIBOR.
(b) As a percentage of average gross credit card receivables.
(c) Spread to LIBOR is a metric used to analyze the performance of our total credit card portfolio because the majority of our portfolio
earned finance charge revenue at rates tied to the Prime Rate, and the interest rate on all nonrecourse debt securitized by credit card
receivables is tied to LIBOR.
Our primary measure of segment profit in our Credit Card Segment is the EBIT generated by our total
credit card receivables portfolio less the interest expense on nonrecourse debt collateralized by credit card
receivables. We analyze this measure of profit in light of the amount of capital we have invested in our credit
card receivables. In addition, we measure the performance of our overall credit card receivables portfolio by
calculating the dollar Spread to LIBOR at the portfolio level. This metric approximates overall financial
performance of the entire credit card portfolio we manage by measuring the difference between EBIT earned
on the portfolio and a hypothetical benchmark rate financing cost applied to the entire portfolio. The interest
rate on all nonrecourse debt securitized by credit card receivables is tied to LIBOR. For the first quarter of
2009, the vast majority of our portfolio accrued finance charge revenue at rates tied to the Prime Rate. Effective
April 2009, we implemented a terms change to our portfolio that established a minimum annual percentage
rate (APR) applied to cardholder account balances. Under these terms, finance charges accrue at a fixed APR
if the benchmark Prime Rate is less than 6%; if the Prime Rate is greater than 6%, finance charges accrue at
the benchmark Prime Rate, plus a spread. Because the Prime Rate was less than 6% during 2009, the majority
of our portfolio accrued finance charges at a fixed APR subsequent to this terms change. As a result of
regulatory actions that impact our portfolio, effective January 2010, we implemented a second terms change
that converted the minimum APR for the majority of our accounts to a variable rate, and we eliminated penalty
16