Target 2009 Annual Report Download - page 67
Download and view the complete annual report
Please find page 67 of the 2009 Target annual report below. You can navigate through the pages in the report by either clicking on the pages listed below, or by using the keyword search tool below to find specific information within the annual report.-
 1
1 -
2
-
3
-
4
-
5
-
6
-
7
-
8
-
9
-
10
-
11
-
12
-
13
-
14
-
15
-
16
-
17
-
18
-
19
-
20
-
21
-
22
-
23
-
24
-
25
-
26
-
27
-
28
-
29
-
30
-
31
-
32
-
33
-
34
-
35
-
36
-
37
-
38
-
39
-
40
-
41
-
42
-
43
-
44
-
45
-
46
-
47
-
48
-
49
-
50
-
51
-
52
-
53
-
54
-
55
-
56
-
 57
57 -
 58
58 -
 59
59 -
 60
60 -
 61
61 -
 62
62 -
 63
63 -
 64
64 -
 65
65 -
 66
66 -
 67
67 -
 68
68 -
 69
69 -
 70
70 -
 71
71 -
 72
72 -
 73
73 -
 74
74 -
 75
75 -
 76
76 -
 77
77 -
78
-
79
-
80
-
81
-
82
-
83
-
84
-
85
-
86
-
87
-
88
 |
 |

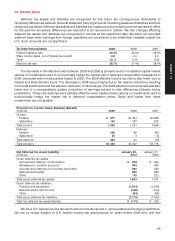
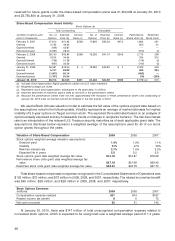
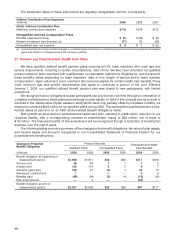
reserved for future grants under the share-based compensation plans was 21,450,009 at January 30, 2010
and 25,755,800 at January 31, 2009.
Share-Based Compensation Award Activity
Stock Options (a)
Total Outstanding Exercisable
(number of options and No. of Exercise Intrinsic No. of Exercise Intrinsic Performance Restricted
units in thousands) Options Price (b) Value (c) Options Price (b) Value (c) Share Units (d) Stock Units
February 3, 2007 27,910 $41.95 $558 17,659 $35.32 $470 1,895 221
Granted 5,725 49.54 650 21
Expired/forfeited (434) 52.67 — —
Exercised/issued (5,061) 28.00 (370) (4)
February 2, 2008 28,140 $45.84 $298 16,226 $41.07 $245 2,175 238
Granted 9,914 34.64 764 315
Expired/forfeited (756) 51.28 (176) (2)
Exercised/issued (937) 33.36 (740) (2)
January 31, 2009 36,361 $43.00 $ 4 19,292 $43.80 $ 4 2,023 549
Granted 5,127 49.08 826 224
Expired/forfeited (1,507) 46.14 (662) —
Exercised/issued (1,767) 35.34 (14) (203)
January 30, 2010 38,214 $44.05 $331 22,446 $44.59 $189 2,173 (e) 570
(a) Includes Stock Appreciation Rights granted to certain non-U.S. team members.
(b) Weighted average per share.
(c) Represents stock price appreciation subsequent to the grant date, in millions.
(d) Assumes attainment of maximum payout rates as set forth in the performance criteria.
(e) Because the performance criteria were not met, approximately 644 thousand of these performance share units outstanding at
January 30, 2010 were not earned and will be forfeited in the first quarter of 2010.
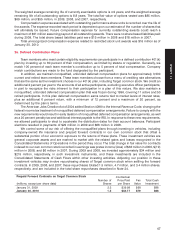
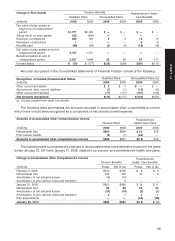
We used a Black-Scholes valuation model to estimate the fair value of the options at grant date based on
the assumptions noted in the following table. Volatility represents an average of market estimates for implied
volatility of 5.5-year options on Target common stock. The expected life is estimated based on an analysis of
options already exercised and any foreseeable trends or changes in recipients’ behavior. The risk-free interest
rate is an interpolation of the relevant U.S. Treasury security maturities as of each applicable grant date. The
assumptions disclosed below represent a weighted average of the assumptions used for all of our stock
option grants throughout the years.
Valuation of Share-Based Compensation 2009 2008 2007
Stock options weighted average valuation assumptions:
Dividend yield 1.4% 1.9% 1.1%
Volatility 31% 47% 39%
Risk-free interest rate 2.7% 1.5% 3.2%
Expected life in years 5.5 5.5 5.5
Stock options grant date weighted average fair value $14.18 $12.87 $18.08
Performance share units grant date weighted average fair
value $27.18 $51.68 $59.45
Restricted stock units grant date weighted average fair value $48.94 $34.78 $57.70
Total share-based compensation expense recognized in the Consolidated Statements of Operations was
$103 million, $72 million, and $73 million in 2009, 2008, and 2007, respectively. The related income tax benefit
was $40 million, $28 million, and $28 million in 2009, 2008, and 2007, respectively.
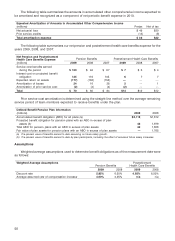
Stock Options Exercises
(millions) 2009 2008 2007
Compensation expense realized $21 $14 $187
Related income tax benefit 8573
Net cash proceeds 62 31 142
At January 30, 2010, there was $147 million of total unrecognized compensation expense related to
nonvested stock options, which is expected to be recognized over a weighted average period of 1.4 years.
46