Target 2009 Annual Report Download - page 55
Download and view the complete annual report
Please find page 55 of the 2009 Target annual report below. You can navigate through the pages in the report by either clicking on the pages listed below, or by using the keyword search tool below to find specific information within the annual report.-
 1
1 -
2
-
3
-
4
-
5
-
6
-
7
-
8
-
9
-
10
-
11
-
12
-
13
-
14
-
15
-
16
-
17
-
18
-
19
-
20
-
21
-
22
-
23
-
24
-
25
-
26
-
27
-
28
-
29
-
30
-
31
-
32
-
33
-
34
-
35
-
36
-
37
-
38
-
39
-
40
-
41
-
42
-
43
-
44
-
 45
45 -
 46
46 -
 47
47 -
 48
48 -
 49
49 -
 50
50 -
 51
51 -
 52
52 -
 53
53 -
 54
54 -
 55
55 -
 56
56 -
 57
57 -
 58
58 -
 59
59 -
 60
60 -
 61
61 -
 62
62 -
 63
63 -
 64
64 -
 65
65 -
66
-
67
-
68
-
69
-
70
-
71
-
72
-
73
-
74
-
75
-
76
-
77
-
78
-
79
-
80
-
81
-
82
-
83
-
84
-
85
-
86
-
87
-
88
 |
 |
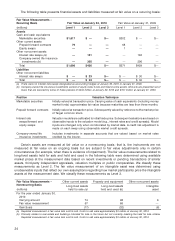
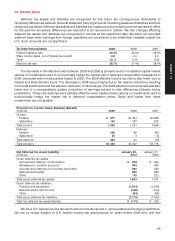
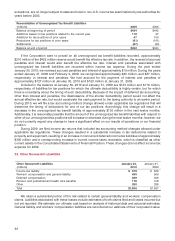
The following table presents financial assets and liabilities measured at fair value on a recurring basis:
Fair Value Measurements –
Recurring Basis Fair Value at January 30, 2010 Fair Value at January 31, 2009
(millions) Level 1 Level 2 Level 3 Level 1 Level 2 Level 3
Assets
Cash and cash equivalents
Marketable securities $1,617 $ — $— $302 $ — $—
Other current assets
Prepaid forward contracts 79 — — 68 — —
Equity swaps ——— 1——
Other noncurrent assets
Interest rate swaps (a) — 131 — — 163 —
Company-owned life insurance
investments (b) — 305 — — 296 —
Total $1,696 $436 $— $371 $459 $—
Liabilities
Other noncurrent liabilities
Interest rate swaps $— $23 $— $— $30 $—
Total $— $23 $— $— $30 $—
(a) There were no interest rate swaps designated as accounting hedges at January 30, 2010 or January 31, 2009.
(b) Company-owned life insurance investments consist of equity index funds and fixed income assets. Amounts are presented net of
loans that are secured by some of these policies of $244 million at January 30, 2010 and $197 million at January 31, 2009.
Position Valuation Technique
Marketable securities Initially valued at transaction price. Carrying value of cash equivalents (including money
market funds) approximates fair value because maturities are less than three months.
Prepaid forward contracts Initially valued at transaction price. Subsequently valued by reference to the market price
of Target common stock.
Interest rate Valuation models are calibrated to initial trade price. Subsequent valuations are based on
swaps/forward and observable inputs to the valuation model (e.g., interest rates and credit spreads). Model
equity swaps inputs are changed only when corroborated by market data. A credit risk adjustment is
made on each swap using observable market credit spreads.
Company-owned life Includes investments in separate accounts that are valued based on market rates
insurance investments credited by the insurer.
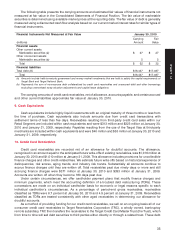
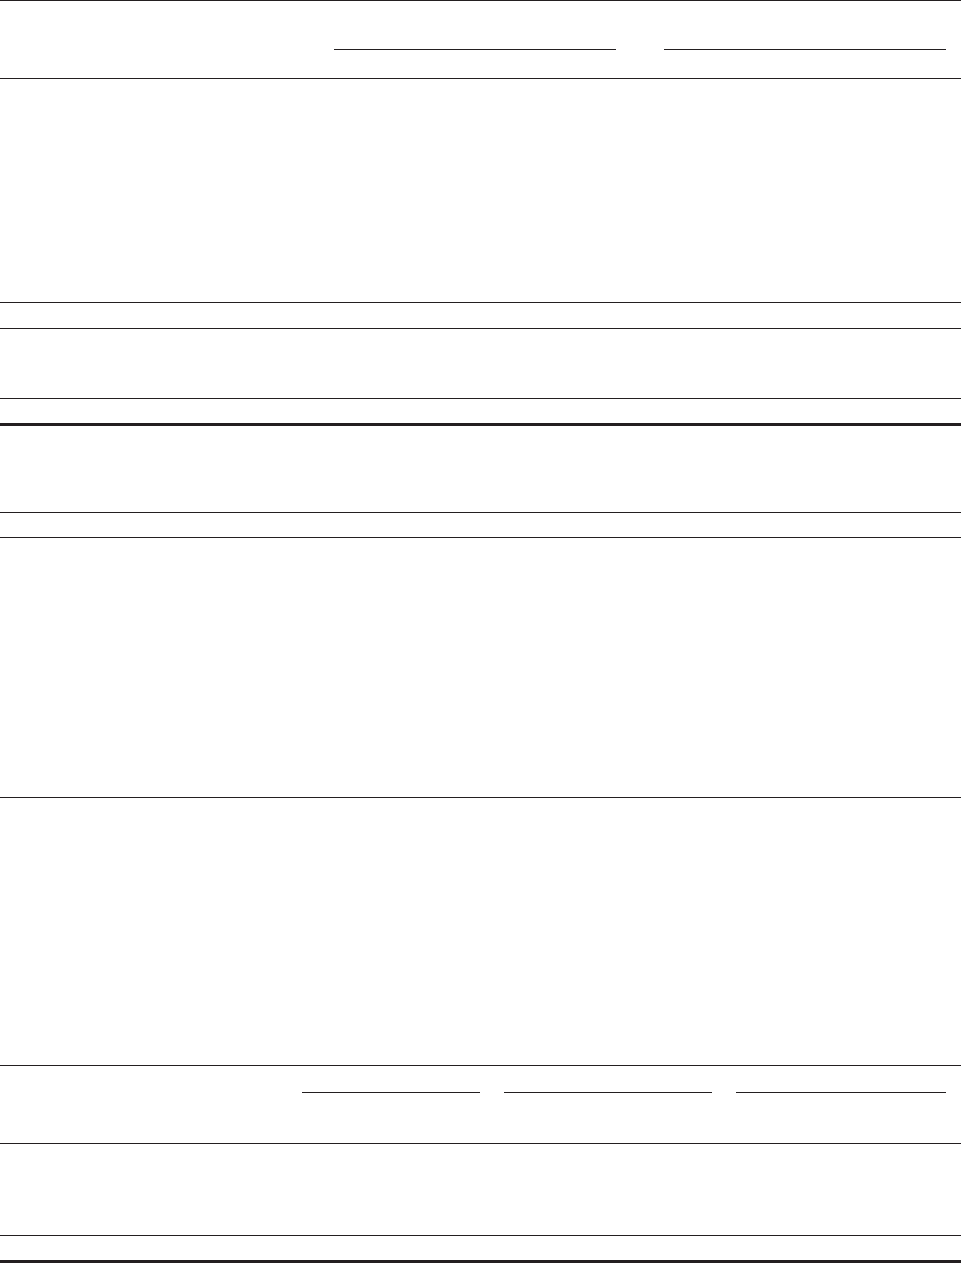
Certain assets are measured at fair value on a nonrecurring basis; that is, the instruments are not
measured at fair value on an ongoing basis but are subject to fair value adjustments only in certain
circumstances (for example, when there is evidence of impairment). The fair value measurements related to
long-lived assets held for sale and held and used in the following table were determined using available
market prices at the measurement date based on recent investments or pending transactions of similar
assets, third-party independent appraisals, valuation multiples or public comparables. We classify these
measurements as Level 2. The fair value measurement of an intangible asset was determined using
unobservable inputs that reflect our own assumptions regarding how market participants price the intangible
assets at the measurement date. We classify these measurements as Level 3.
Fair Value Measurements – Other current assets Property and equipment Other noncurrent assets
Nonrecurring Basis Long-lived assets Long-lived assets Intangible
(millions) held for sale (a) held and used (b) asset
For the year ended January 30,
2010:
Carrying amount 74 98 6
Fair value measurement 57 66 —
Gain/(loss) (17) (32) (6)
(a) Reported measurement is fair value less cost to sell. Costs to sell were approximately $3 million at January 30, 2010.
(b) Primarily relates to real estate and buildings intended for sale in the future but not currently meeting the held for sale criteria.
Reported measurement is fair value less cost to sell. Costs to sell were approximately $3 million at January 30, 2010.
34