Target 2009 Annual Report Download - page 33
Download and view the complete annual report
Please find page 33 of the 2009 Target annual report below. You can navigate through the pages in the report by either clicking on the pages listed below, or by using the keyword search tool below to find specific information within the annual report.-
 1
1 -
2
-
3
-
4
-
5
-
6
-
7
-
8
-
9
-
10
-
11
-
12
-
13
-
14
-
15
-
16
-
17
-
18
-
19
-
20
-
21
-
22
-
 23
23 -
 24
24 -
 25
25 -
 26
26 -
 27
27 -
 28
28 -
 29
29 -
 30
30 -
 31
31 -
 32
32 -
 33
33 -
 34
34 -
 35
35 -
 36
36 -
 37
37 -
 38
38 -
 39
39 -
 40
40 -
 41
41 -
 42
42 -
 43
43 -
44
-
45
-
46
-
47
-
48
-
49
-
50
-
51
-
52
-
53
-
54
-
55
-
56
-
57
-
58
-
59
-
60
-
61
-
62
-
63
-
64
-
65
-
66
-
67
-
68
-
69
-
70
-
71
-
72
-
73
-
74
-
75
-
76
-
77
-
78
-
79
-
80
-
81
-
82
-
83
-
84
-
85
-
86
-
87
-
88
 |
 |
6MAR201021543927
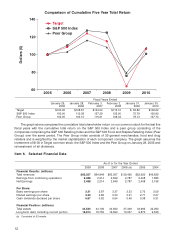
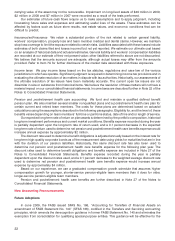
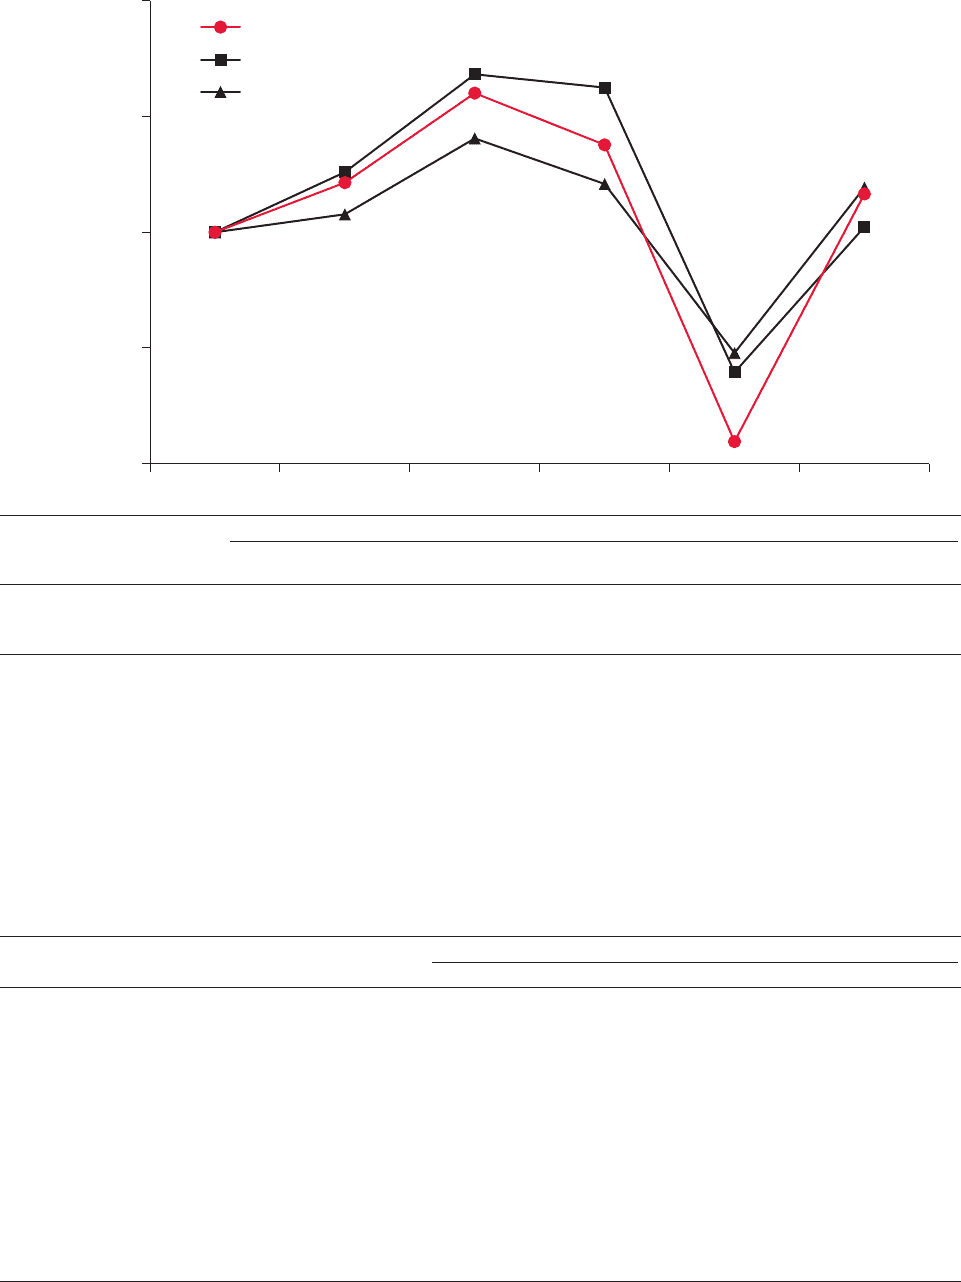
Comparison of Cumulative Five Year Total Return
2005 2006 2007 2008 20102009
Dollars ($)
Peer Group
Target
60
100
120
80
140
S&P 500 Index
Fiscal Years Ended
January 29, January 28, February 3, February 2, January 31, January 30,
2005 2006 2007 2008 2009 2010
Target $100.00 $108.57 $124.04 $115.10 $ 63.82 $106.62
S&P 500 Index 100.00 110.38 127.29 125.00 75.79 100.90
Peer Group 100.00 103.10 116.21 108.34 79.13 107.73
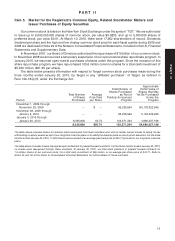
The graph above compares the cumulative total shareholder return on our common stock for the last five
fiscal years with the cumulative total return on the S&P 500 Index and a peer group consisting of the
companies comprising the S&P 500 Retailing Index and the S&P 500 Food and Staples Retailing Index (Peer
Group) over the same period. The Peer Group index consists of 39 general merchandise, food and drug
retailers and is weighted by the market capitalization of each component company. The graph assumes the
investment of $100 in Target common stock, the S&P 500 Index and the Peer Group on January 29, 2005 and
reinvestment of all dividends.
Item 6. Selected Financial Data
As of or for the Year Ended
2009 2008 2007 2006 (a) 2005 2004
Financial Results: (millions)
Total revenues $65,357 $64,948 $63,367 $ 59,490 $52,620 $46,839
Earnings from continuing operations 2,488 2,214 2,849 2,787 2,408 1,885
Net Earnings 2,488 2,214 2,849 2,787 2,408 3,198
Per Share:
Basic earnings per share 3.31 2.87 3.37 3.23 2.73 2.09
Diluted earnings per share 3.30 2.86 3.33 3.21 2.71 2.07
Cash dividends declared per share 0.67 0.62 0.54 0.46 0.38 0.31
Financial Position: (millions)
Total assets 44,533 44,106 44,560 37,349 34,995 32,293
Long-term debt, including current portion 16,814 18,752 16,590 10,037 9,872 9,538
(a) Consisted of 53 weeks.
12