Target 2009 Annual Report Download - page 64
Download and view the complete annual report
Please find page 64 of the 2009 Target annual report below. You can navigate through the pages in the report by either clicking on the pages listed below, or by using the keyword search tool below to find specific information within the annual report.-
 1
1 -
2
-
3
-
4
-
5
-
6
-
7
-
8
-
9
-
10
-
11
-
12
-
13
-
14
-
15
-
16
-
17
-
18
-
19
-
20
-
21
-
22
-
23
-
24
-
25
-
26
-
27
-
28
-
29
-
30
-
31
-
32
-
33
-
34
-
35
-
36
-
37
-
38
-
39
-
40
-
41
-
42
-
43
-
44
-
45
-
46
-
47
-
48
-
49
-
50
-
51
-
52
-
53
-
 54
54 -
 55
55 -
 56
56 -
 57
57 -
 58
58 -
 59
59 -
 60
60 -
 61
61 -
 62
62 -
 63
63 -
 64
64 -
 65
65 -
 66
66 -
 67
67 -
 68
68 -
 69
69 -
 70
70 -
 71
71 -
 72
72 -
 73
73 -
 74
74 -
75
-
76
-
77
-
78
-
79
-
80
-
81
-
82
-
83
-
84
-
85
-
86
-
87
-
88
 |
 |

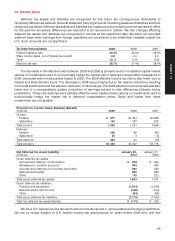
22. Income Taxes
Deferred tax assets and liabilities are recognized for the future tax consequences attributable to
temporary differences between financial statement carrying amounts of existing assets and liabilities and their
respective tax bases. Deferred tax assets and liabilities are measured using enacted income tax rates in effect
for the year the temporary differences are expected to be recovered or settled. Tax rate changes affecting
deferred tax assets and liabilities are recognized in income at the enactment date. We have not recorded
deferred taxes when earnings from foreign operations are considered to be indefinitely invested outside the
U.S. Such amounts are not significant.
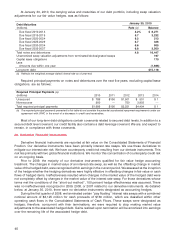
Tax Rate Reconciliation 2009 2008 2007
Federal statutory rate 35.0% 35.0% 35.0%
State income taxes, net of federal tax benefit 3.8 4.0 4.0
Other (3.1) (1.6) (0.6)
Effective tax rate 35.7% 37.4% 38.4%
The decrease in the effective rates between 2009 and 2008 is primarily due to nontaxable capital market
returns on investments used to economically hedge the market risk in deferred compensation obligations in
2009 compared with nondeductible losses in 2008. The 2009 effective income tax rate is also lower due to
federal and state discrete items. The decrease in 2008 was primarily due to tax reserve reductions resulting
from audit settlements and the effective resolution of other issues. The 2008 effective income tax rate was also
lower due to a comparatively greater proportion of earnings subject to rate differences between taxing
jurisdictions. These rate declines were partially offset by lower capital market returns on investments used to
economically hedge the market risk in deferred compensation plans. Gains and losses from these
investments are not taxable.
Provision for Income Taxes: Expense/(Benefit)
(millions) 2009 2008 2007
Current:
Federal $ 877 $1,034 $1,568
State/other 143 197 278
Total current 1,020 1,231 1,846
Deferred:
Federal 339 88 (67)
State/other 25 3(3)
Total deferred 364 91 (70)
Total provision $1,384 $1,322 $1,776
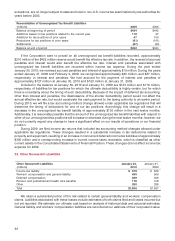
Net Deferred Tax Asset/(Liability) January 30, January 31,
(millions) 2010 2009
Gross deferred tax assets:
Accrued and deferred compensation $ 538 $ 420
Allowance for doubtful accounts 393 390
Accruals and reserves not currently deductible 380 349
Self-insured benefits 260 289
Other 92 223
Total gross deferred tax assets 1,663 1,671
Gross deferred tax liabilities:
Property and equipment (1,543) (1,234)
Deferred credit card income (166) (144)
Other (64) (55)
Total gross deferred tax liabilities (1,773) (1,433)
Total net deferred tax asset/(liability) $ (110) $ 238
We file a U.S. federal income tax return and income tax returns in various states and foreign jurisdictions.
We are no longer subject to U.S. federal income tax examinations for years before 2006 and, with few
43
PART II