Target 2009 Annual Report Download - page 38
Download and view the complete annual report
Please find page 38 of the 2009 Target annual report below. You can navigate through the pages in the report by either clicking on the pages listed below, or by using the keyword search tool below to find specific information within the annual report.-
 1
1 -
2
-
3
-
4
-
5
-
6
-
7
-
8
-
9
-
10
-
11
-
12
-
13
-
14
-
15
-
16
-
17
-
18
-
19
-
20
-
21
-
22
-
23
-
24
-
25
-
26
-
27
-
 28
28 -
 29
29 -
 30
30 -
 31
31 -
 32
32 -
 33
33 -
 34
34 -
 35
35 -
 36
36 -
 37
37 -
 38
38 -
 39
39 -
 40
40 -
 41
41 -
 42
42 -
 43
43 -
 44
44 -
 45
45 -
 46
46 -
 47
47 -
 48
48 -
49
-
50
-
51
-
52
-
53
-
54
-
55
-
56
-
57
-
58
-
59
-
60
-
61
-
62
-
63
-
64
-
65
-
66
-
67
-
68
-
69
-
70
-
71
-
72
-
73
-
74
-
75
-
76
-
77
-
78
-
79
-
80
-
81
-
82
-
83
-
84
-
85
-
86
-
87
-
88
 |
 |

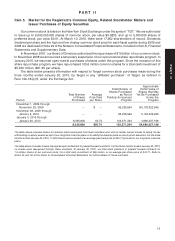
pricing for all current, or nondelinquent accounts. Penalty pricing is the charging of a higher interest rate for a
period of time, generally 12 months, and is triggered when a cardholder repeatedly fails to make timely
payments.
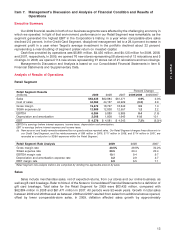
In 2009, Credit Card Segment profit increased to $201 million from $155 million as a result of improved
portfolio performance (Spread to LIBOR) and significantly lower funding costs. The reduction in our
investment in the portfolio combined with these results produced a strong improvement in segment ROIC.
Segment revenues were $1,922 million, a decrease of $143 million, or 6.9 percent, from the prior year. The
decrease in revenue was driven by a lower Prime Rate, lower average receivables, higher finance charge and
late-fee write-offs and lower late fees due to fewer delinquent accounts offset by the positive impacts of the
terms changes implemented in late 2008 and April 2009. Segment expenses were $1,624 million, a decrease
of $118 million, or 6.8 percent, from prior year driven by lower bad debt and operations and marketing
expenses, on both a dollar and rate basis. Segment interest expense benefited from a significantly lower
LIBOR rate compared to the prior year.
Segment profit and dollar Spread to LIBOR measures in 2008 were significantly impacted on both a rate
and dollar basis by bad debt expense. Segment revenues were $2,064 million, an increase of $168 million, or
8.9 percent, from the prior year, driven by a 19.5 percent increase in average receivables. On a rate basis,
revenue yield decreased 2.4 percentage points primarily due to a reduction in the Prime Rate index used to
determine finance charge rates in the portfolio and lower external sales volume contributing to the decline in
third party merchant fees. This negative pressure on revenue yield was offset modestly by the positive impact
of terms changes implemented in 2008 that increased our effective yield. Segment expenses were
$1,742 million, an increase of $776 million, or 80.3 percent, from the prior year driven by an increase in bad
debt expense of $770 million. The increase in bad debt expense resulted from the increase in our incurred net
write-off rate from 5.9 percent in 2007 to 9.3 percent in 2008 and the increase in the allowance for doubtful
accounts of $440 million for anticipated future write-offs of current receivables. Segment profit decreased from
16.3 percent in 2007 to 3.7 percent in 2008 primarily due to the effect of bad debt expense, the reduction in
receivables owned and funded by Target, and the impact of a lower Prime Rate during 2008.
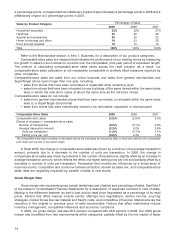
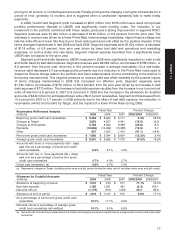
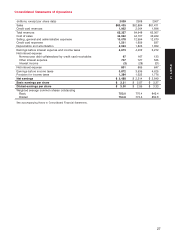
Fiscal Year Percent Change
Receivables Rollforward Analysis
(millions) 2009 2008 2007 2009/2008 2008/2007
Beginning gross credit card receivables $ 9,094 $ 8,624 $ 6,711 5.4% 28.5%
Charges at Target 3,553 4,207 4,491 (15.5) (6.3)
Charges at third parties 6,763 8,542 9,398 (20.8) (9.1)
Payments (12,065) (13,482) (13,388) (10.5) 0.7
Other 637 1,203 1,412 (47.1) (14.8)
Period-end gross credit card receivables $ 7,982 $ 9,094 $ 8,624 (12.2)% 5.4%
Average gross credit card receivables $ 8,351 $ 8,695 $ 7,275 (4.0)% 19.5%
Accounts with three or more payments (60+ days)
past due as a percentage of period-end credit
card receivables 6.3% 6.1% 4.0%
Accounts with four or more payments (90+ days)
past due as a percentage of period-end gross
credit card receivables 4.7% 4.3% 2.7%
Credit card penetration (a) 5.6% 6.7% 7.3%
(a) Represents charges at Target (including sales taxes and gift cards) divided by sales (which excludes sales taxes and gift cards).
Fiscal Year Percent Change
Allowance for Doubtful Accounts
(millions) 2009 2008 2007 2009/2008 2008/2007
Allowance at beginning of period $ 1,010 $ 570 $ 517 77.1% 10.4%
Bad debt expense 1,185 1,251 481 (5.3) 160.1
Net write-offs (a) (1,179) (811) (428) 45.2 89.8
Allowance at end of period $ 1,016 $ 1,010 $ 570 0.6% 77.1%
As a percentage of period-end gross credit card
receivables 12.7% 11.1% 6.6%
Net write-offs as a percentage of average gross
credit card receivables (annualized) 14.1% 9.3% 5.9%
(a) Net write-offs include the principal amount of losses (excluding accrued and unpaid finance charges) less current period principal
recoveries.
17
PART II