Target 2009 Annual Report Download - page 50
Download and view the complete annual report
Please find page 50 of the 2009 Target annual report below. You can navigate through the pages in the report by either clicking on the pages listed below, or by using the keyword search tool below to find specific information within the annual report.-
 1
1 -
2
-
3
-
4
-
5
-
6
-
7
-
8
-
9
-
10
-
11
-
12
-
13
-
14
-
15
-
16
-
17
-
18
-
19
-
20
-
21
-
22
-
23
-
24
-
25
-
26
-
27
-
28
-
29
-
30
-
31
-
32
-
33
-
34
-
35
-
36
-
37
-
38
-
39
-
 40
40 -
 41
41 -
 42
42 -
 43
43 -
 44
44 -
 45
45 -
 46
46 -
 47
47 -
 48
48 -
 49
49 -
 50
50 -
 51
51 -
 52
52 -
 53
53 -
 54
54 -
 55
55 -
 56
56 -
 57
57 -
 58
58 -
 59
59 -
 60
60 -
61
-
62
-
63
-
64
-
65
-
66
-
67
-
68
-
69
-
70
-
71
-
72
-
73
-
74
-
75
-
76
-
77
-
78
-
79
-
80
-
81
-
82
-
83
-
84
-
85
-
86
-
87
-
88
 |
 |

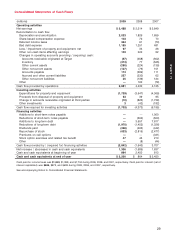
Consolidated Statements of Cash Flows
(millions) 2009 2008 2007
Operating activities
Net earnings $ 2,488 $ 2,214 $ 2,849
Reconciliation to cash flow
Depreciation and amortization 2,023 1,826 1,659
Share-based compensation expense 103 72 73
Deferred income taxes 364 91 (70)
Bad debt expense 1,185 1,251 481
Loss / impairment of property and equipment, net 97 33 28
Other non-cash items affecting earnings 103 222 52
Changes in operating accounts providing / (requiring) cash:
Accounts receivable originated at Target (57) (458) (602)
Inventory (474) 77 (525)
Other current assets (280) (224) (139)
Other noncurrent assets (127) (76) 101
Accounts payable 174 (389) 111
Accrued and other current liabilities 257 (230) 62
Other noncurrent liabilities 25 (139) 124
Other —160 (79)
Cash flow provided by operations 5,881 4,430 4,125
Investing activities
Expenditures for property and equipment (1,729) (3,547) (4,369)
Proceeds from disposal of property and equipment 33 39 95
Change in accounts receivable originated at third parties (10) (823) (1,739)
Other investments 3(42) (182)
Cash flow required for investing activities (1,703) (4,373) (6,195)
Financing activities
Additions to short-term notes payable —— 1,000
Reductions of short-term notes payable —(500) (500)
Additions to long-term debt —3,557 7,617
Reductions of long-term debt (1,970) (1,455) (1,326)
Dividends paid (496) (465) (442)
Repurchase of stock (423) (2,815) (2,477)
Premiums on call options —— (331)
Stock option exercises and related tax benefit 47 43 210
Other —(8) (44)
Cash flow provided by / (required for) financing activities (2,842) (1,643) 3,707
Net increase / (decrease) in cash and cash equivalents 1,336 (1,586) 1,637
Cash and cash equivalents at beginning of year 864 2,450 813
Cash and cash equivalents at end of year $ 2,200 $ 864 $ 2,450
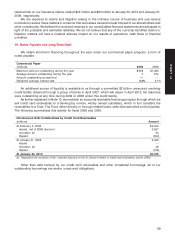
Cash paid for income taxes was $1,040, $1,399, and $1,734 during 2009, 2008, and 2007, respectively. Cash paid for interest (net of
interest capitalized) was $805, $873, and $633 during 2009, 2008, and 2007, respectively.
See accompanying Notes to Consolidated Financial Statements.
29
PART II