Target 2009 Annual Report Download - page 18
Download and view the complete annual report
Please find page 18 of the 2009 Target annual report below. You can navigate through the pages in the report by either clicking on the pages listed below, or by using the keyword search tool below to find specific information within the annual report.-
 1
1 -
2
-
3
-
4
-
5
-
6
-
7
-
 8
8 -
 9
9 -
 10
10 -
 11
11 -
 12
12 -
 13
13 -
 14
14 -
 15
15 -
 16
16 -
 17
17 -
 18
18 -
 19
19 -
 20
20 -
 21
21 -
 22
22 -
 23
23 -
 24
24 -
 25
25 -
 26
26 -
 27
27 -
 28
28 -
29
-
30
-
31
-
32
-
33
-
34
-
35
-
36
-
37
-
38
-
39
-
40
-
41
-
42
-
43
-
44
-
45
-
46
-
47
-
48
-
49
-
50
-
51
-
52
-
53
-
54
-
55
-
56
-
57
-
58
-
59
-
60
-
61
-
62
-
63
-
64
-
65
-
66
-
67
-
68
-
69
-
70
-
71
-
72
-
73
-
74
-
75
-
76
-
77
-
78
-
79
-
80
-
81
-
82
-
83
-
84
-
85
-
86
-
87
-
88
 |
 |

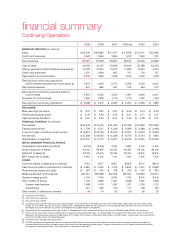
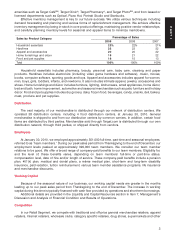
2009 2008 2007 2006 (a) 2005 2004
FINANCIAL RESULTS: (in millions)
Sales $ 63,435 $ 62,884 $ 61,471 $ 57,878 $ 51,271 $ 45,682
Credit card revenues 1,922 2,064 1,896 1,612 1,349 1,157
Total revenues 65,357 64,948 63,367 59,490 52,620 46,839
Cost of sales 44,062 44,157 42,929 40,366 35,788 32,226
Selling, general and administrative expenses (b)
13,078 12,954 12,670 11,852 10,324 9,016
Credit card expenses 1,521 1,609 837 707 776 737
Depreciation and amortization 2,023 1,826 1,659 1,496 1,409 1,259
Earnings from continuing operations
before interest expense and income taxes (c)
4,673 4,402 5,272 5,069 4,323 3,601
Net interest expense 801 866 647 572 463 570
Earnings from continuing operations before
income taxes 3,872 3,536 4,625 4,497 3,860 3,031
Provision for income taxes 1,384 1,322 1,776 1,710 1,452 1,146
Earnings from continuing operations $ 2,488 $ 2,214 $ 2,849 $ 2,787 $ 2,408 $ 1,885
PER SHARE:
Basic earnings per share $ 3.31 $ 2.87 $ 3.37 $ 3.23 $ 2.73 $ 2.09
Diluted earnings per share $ 3.30 $ 2.86 $ 3.33 $ 3.21 $ 2.71 $ 2.07
Cash dividends declared $ 0.67 $ 0.62 $ 0.54 $ 0.46 $ 0.38 $ 0.31
FINANCIAL POSITION: (in millions)
Total assets $ 44,533 $ 44,106 $ 44,560 $ 37,349 $ 34,995 $ 32,293
Capital expenditures $ 1,729 $ 3,547 $ 4,369 $ 3,928 $ 3,388 $ 3,068
Long-term debt, including current portion $ 16,814 $ 18,752 $ 16,590 $ 10,037 $ 9,872 $ 9,538
Net debt (d) $ 15,288 $ 18,562 $ 15,238 $ 9,756 $ 8,700 $ 7,806
Shareholders’ investment $ 15,347 $ 13,712 $ 15,307 $ 15,633 $ 14,205 $ 13,029
RETAIL SEGMENT FINANCIAL RATIOS:
Comparable-store sales growth (e) (2.5%) (2.9%) 3.0% 4.8% 5.6% 5.3%
Gross margin (% of sales) 30.5% 29.8% 30.2% 30.3% 30.2% 29.5%
SG&A (% of sales) (f) 20.5% 20.4% 20.4% 20.3% 19.9% 19.6%
EBIT margin (% of sales) 6.9% 6.5% 7.1% 7.4% 7.5% 7.2%
OTHER:
Common shares outstanding (in millions) 744.6 752.7 818.7 859.8 874.1 890.6
Cash flow provided by operations (in millions) $ 5,881 $ 4,430 $ 4,125 $ 4,862 $ 4,451 $ 3,808
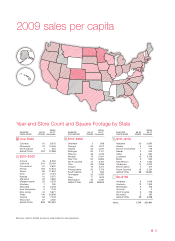
Revenues per square foot (g)(h) $ 287 $ 301 $ 318 $ 316 $ 307 $ 294
Retail square feet (in thousands) 231,941 222,588 207,945 192,064 178,260 165,015
Square footage growth 4.2% 7.0% 8.3% 7.7% 8.0% 8.2%
Total number of stores 1,740 1,682 1,591 1,488 1,397 1,308
General merchandise 1,489 1,443 1,381 1,311 1,239 1,172
SuperTarget 251 239 210 177 158 136
Total number of distribution centers 38 34 32 29 26 25
(a) Consisted of 53 weeks.
(b) Also referred to as SG&A.
(c) Also referred to as EBIT.
(d) Including current portion and short-term notes payable, net of domestic marketable securities of $1,526 million, $190 million, $1,851 million, $281
million, $1,172 million, and $1,732 million, respectively. Management believes this measure is a more appropriate indicator of our level of financial
leverage because marketable securities are available to pay debt maturity obligations.
(e) See definition of comparable-store sales in Item 7, Management’s Discussion and Analysis of Financial Condition and Results of Operations.
(f) New account and loyalty rewards redeemed by our guests reduce reported sales. Our Retail Segment charges these discounts to our Credit Card
Segment, and the reimbursements of $89 million, $117 million, $114 million, $109 million, $98 million, and $80 million, respectively, are recorded as a
reduction to SG&A within the Retail Segment.
(g) Thirteen-month average retail square feet.
(h) In 2006, revenues per square foot were calculated with 52 weeks of revenues (the 53rd week of revenues was excluded) because management
believes that these numbers provide a more useful analytical comparison to other years. Using our revenues for the 53-week year under generally
accepted accounting principles, 2006 revenues per square foot were $322.
nancial summary
Continuing Operations