Priceline 2015 Annual Report Download - page 98
Download and view the complete annual report
Please find page 98 of the 2015 Priceline annual report below. You can navigate through the pages in the report by either clicking on the pages listed below, or by using the keyword search tool below to find specific information within the annual report.-
 1
1 -
2
-
3
-
4
-
5
-
6
-
7
-
8
-
9
-
10
-
11
-
12
-
13
-
14
-
15
-
16
-
17
-
18
-
19
-
20
-
21
-
22
-
23
-
24
-
25
-
26
-
27
-
28
-
29
-
30
-
31
-
32
-
33
-
34
-
35
-
36
-
37
-
38
-
39
-
40
-
41
-
42
-
43
-
44
-
45
-
46
-
47
-
48
-
49
-
50
-
51
-
52
-
53
-
54
-
55
-
56
-
57
-
58
-
59
-
60
-
61
-
62
-
63
-
64
-
65
-
66
-
67
-
68
-
69
-
70
-
71
-
72
-
73
-
74
-
75
-
76
-
77
-
78
-
79
-
80
-
81
-
82
-
83
-
84
-
85
-
86
-
87
-
 88
88 -
 89
89 -
 90
90 -
 91
91 -
 92
92 -
 93
93 -
 94
94 -
 95
95 -
 96
96 -
 97
97 -
 98
98 -
 99
99 -
 100
100 -
 101
101 -
 102
102 -
 103
103 -
 104
104 -
 105
105 -
 106
106 -
 107
107 -
 108
108 -
109
-
110
-
111
-
112
-
113
-
114
-
115
-
116
-
117
-
118
-
119
-
120
-
121
-
122
-
123
-
124
-
125
-
126
-
127
-
128
-
129
-
130
-
131
-
132
-
133
-
134
-
135
-
136
-
137
-
138
-
139
-
140
-
141
-
142
-
143
-
144
-
145
 |
 |

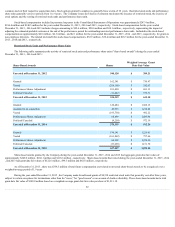
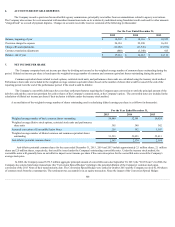
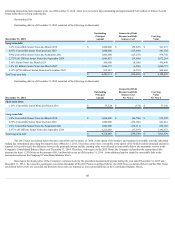
Stock Options
The following table summarizes the activity for the stock options during the years ended December 31, 2013 , 2014 and 2015 :
Employee Stock Options
Number of
Shares
Weighted Average
Exercise Price
Aggregate
Intrinsic Value
(000's)
Weighted Average
Remaining
Contractual Term
(in years)
Balance, December 31, 2012
71,001
$ 19.73
$ 42,647
1.3
Assumed in acquisitions
540,179
$ 260.96
Exercised
(449,670)
$ 194.68
Forfeited
(23,802)
$ 478.83
Balance, December 31, 2013
137,708
$ 315.36
$ 116,686
6.6
Assumed in acquisitions
61,897
$ 457.67
Exercised
(51,003)
$ 293.59
Forfeited
(2,217)
$ 517.91
Balance, December 31, 2014
146,385
$ 380.05
$ 111,277
6.5
Assumed in acquisitions
1,422
$ 230.37
Exercised
(52,697)
$ 355.85
Forfeited
(6,006)
$ 511.87
Balance, December 31, 2015
89,104
$ 383.03
$ 79,474
5.4
Vested and exercisable as of December 31, 2015
72,654
$ 354.59
$ 66,868
5.0
Vested and exercisable as of December 31, 2015 and
expected to vest thereafter, net of estimated forfeitures
88,687
$ 383.06
$ 79,099
5.4
The aggregate intrinsic value of employee stock options exercised during the years ended December 31, 2015 , 2014 and 2013 was $46.3 million , $49.2
million and $281.8 million , respectively. During the years ended December 31, 2015 , 2014 and 2013 , stock options assumed in acquisitions vested for 38,689 ,
41,524 and 65,293 shares with an acquisition-date fair value of $24.4 million , $24.2 million and $30.9 million , respectively.
For the years ended December 31, 2015 , 2014 and 2013 , the Company recorded stock-based compensation expense related to employee stock options of
$24.9 million , $24.7 million and $30.9 million , respectively. Employee stock options assumed in acquisitions during the year ended December 31, 2015 had a
total acquisition-date fair value of $1.4 million based on a weighted-average acquisition date fair value of $1,015.81 per share. As of December 31, 2015 , there
was $9.7 million of total future compensation costs related to unvested employee stock options to be recognized over a weighted-average period of 1.3 years .
94