Priceline 2015 Annual Report Download - page 83
Download and view the complete annual report
Please find page 83 of the 2015 Priceline annual report below. You can navigate through the pages in the report by either clicking on the pages listed below, or by using the keyword search tool below to find specific information within the annual report.-
 1
1 -
2
-
3
-
4
-
5
-
6
-
7
-
8
-
9
-
10
-
11
-
12
-
13
-
14
-
15
-
16
-
17
-
18
-
19
-
20
-
21
-
22
-
23
-
24
-
25
-
26
-
27
-
28
-
29
-
30
-
31
-
32
-
33
-
34
-
35
-
36
-
37
-
38
-
39
-
40
-
41
-
42
-
43
-
44
-
45
-
46
-
47
-
48
-
49
-
50
-
51
-
52
-
53
-
54
-
55
-
56
-
57
-
58
-
59
-
60
-
61
-
62
-
63
-
64
-
65
-
66
-
67
-
68
-
69
-
70
-
71
-
72
-
 73
73 -
 74
74 -
 75
75 -
 76
76 -
 77
77 -
 78
78 -
 79
79 -
 80
80 -
 81
81 -
 82
82 -
 83
83 -
 84
84 -
 85
85 -
 86
86 -
 87
87 -
 88
88 -
 89
89 -
 90
90 -
 91
91 -
 92
92 -
 93
93 -
94
-
95
-
96
-
97
-
98
-
99
-
100
-
101
-
102
-
103
-
104
-
105
-
106
-
107
-
108
-
109
-
110
-
111
-
112
-
113
-
114
-
115
-
116
-
117
-
118
-
119
-
120
-
121
-
122
-
123
-
124
-
125
-
126
-
127
-
128
-
129
-
130
-
131
-
132
-
133
-
134
-
135
-
136
-
137
-
138
-
139
-
140
-
141
-
142
-
143
-
144
-
145
 |
 |
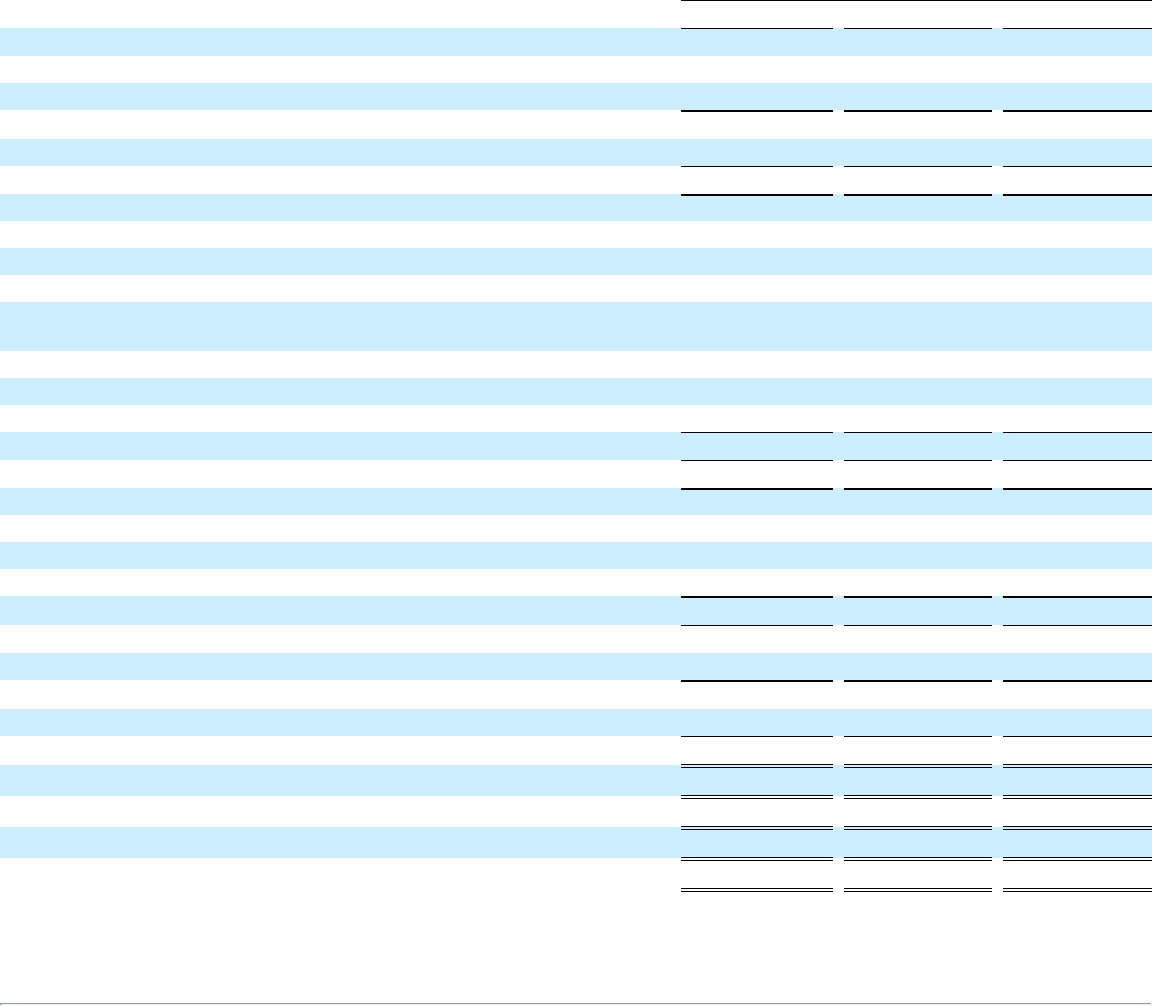
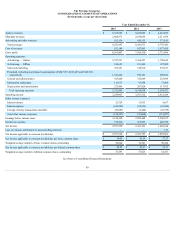
The Priceline Group Inc.
CONSOLIDATED STATEMENTS OF OPERATIONS
(In thousands, except per share data)
Year Ended December 31,
2015
2014
2013
Agency revenues $ 6,527,898
$ 5,845,802
$ 4,410,689
Merchant revenues 2,082,973
2,186,054
2,211,474
Advertising and other revenues 613,116
410,115
171,143
Total revenues 9,223,987
8,441,971
6,793,306
Cost of revenues 632,180
857,841
1,077,420
Gross profit 8,591,807
7,584,130
5,715,886
Operating expenses:
Advertising — Online 2,797,237
2,360,221
1,798,645
Advertising — Offline 214,685
231,309
127,459
Sales and marketing 353,221
310,910
235,817
Personnel, including stock-based compensation of $247,395, $186,425 and $140,526,
respectively 1,166,226
950,191
698,692
General and administrative 415,420
352,869
252,994
Information technology 113,617
97,498
71,890
Depreciation and amortization 272,494
207,820
117,975
Total operating expenses 5,332,900
4,510,818
3,303,472
Operating income 3,258,907
3,073,312
2,412,414
Other income (expense):
Interest income 55,729
13,933
4,167
Interest expense (160,229)
(88,353)
(83,289)
Foreign currency transactions and other (26,087)
(9,444)
(36,755)
Total other income (expense) (130,587)
(83,864)
(115,877)
Earnings before income taxes 3,128,320
2,989,448
2,296,537
Income tax expense 576,960
567,695
403,739
Net income 2,551,360
2,421,753
1,892,798
Less: net income attributable to noncontrolling interests —
—
135
Net income applicable to common stockholders $ 2,551,360
$ 2,421,753
$ 1,892,663
Net income applicable to common stockholders per basic common share $ 50.09
$ 46.30
$ 37.17
Weighted average number of basic common shares outstanding 50,940
52,301
50,924
Net income applicable to common stockholders per diluted common share $ 49.45
$ 45.67
$ 36.11
Weighted average number of diluted common shares outstanding 51,593
53,023
52,413
See Notes to Consolidated Financial Statements.
80