Priceline 2015 Annual Report Download - page 57
Download and view the complete annual report
Please find page 57 of the 2015 Priceline annual report below. You can navigate through the pages in the report by either clicking on the pages listed below, or by using the keyword search tool below to find specific information within the annual report.-
 1
1 -
2
-
3
-
4
-
5
-
6
-
7
-
8
-
9
-
10
-
11
-
12
-
13
-
14
-
15
-
16
-
17
-
18
-
19
-
20
-
21
-
22
-
23
-
24
-
25
-
26
-
27
-
28
-
29
-
30
-
31
-
32
-
33
-
34
-
35
-
36
-
37
-
38
-
39
-
40
-
41
-
42
-
43
-
44
-
45
-
46
-
 47
47 -
 48
48 -
 49
49 -
 50
50 -
 51
51 -
 52
52 -
 53
53 -
 54
54 -
 55
55 -
 56
56 -
 57
57 -
 58
58 -
 59
59 -
 60
60 -
 61
61 -
 62
62 -
 63
63 -
 64
64 -
 65
65 -
 66
66 -
 67
67 -
68
-
69
-
70
-
71
-
72
-
73
-
74
-
75
-
76
-
77
-
78
-
79
-
80
-
81
-
82
-
83
-
84
-
85
-
86
-
87
-
88
-
89
-
90
-
91
-
92
-
93
-
94
-
95
-
96
-
97
-
98
-
99
-
100
-
101
-
102
-
103
-
104
-
105
-
106
-
107
-
108
-
109
-
110
-
111
-
112
-
113
-
114
-
115
-
116
-
117
-
118
-
119
-
120
-
121
-
122
-
123
-
124
-
125
-
126
-
127
-
128
-
129
-
130
-
131
-
132
-
133
-
134
-
135
-
136
-
137
-
138
-
139
-
140
-
141
-
142
-
143
-
144
-
145
 |
 |

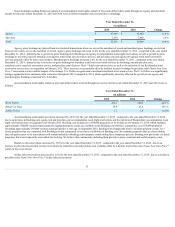
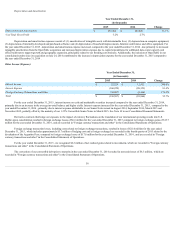
by 25.0% for the year ended December 31, 2015 , compared to the year ended December 31, 2014 . Gross profit for the year ended December 31, 2015 was
positively impacted by the inclusion of OpenTable, which benefited year-over-year comparisons through the anniversary of the acquisition on July 24, 2015. In
addition, gross profit for the year ended December 31, 2015 was positively impacted by a reversal of previously accrued travel transaction taxes of $16.4 million
(including estimated interest and penalties) recorded in the first quarter of 2015 related to a favorable ruling in the State of Hawaii. Gross profit for the year ended
December 31, 2015 was also positively impacted by a net reduction in cost of revenue in the third quarter of 2015 of $13.7 million related to travel transaction
taxes, principally due to a cash refund from the State of Hawaii for the aforementioned favorable ruling.
The U.S. Dollar was significantly stronger against the Euro and many other currencies throughout 2015 compared to 2014. At these exchange rates, the
growth of our total and international gross bookings, expressed in U.S. Dollars, was significantly adversely impacted in 2015.
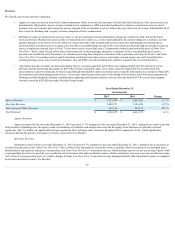
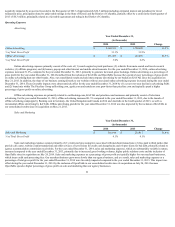
Operating Expenses
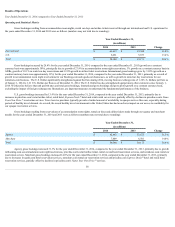
Advertising
Year Ended December 31,
(in thousands)
2015
2014
Change
Online Advertising $ 2,797,237
$ 2,360,221
18.5 %
% of Total Gross Profit 32.6%
31.1%
Offline Advertising $ 214,685
$ 231,309
(7.2)%
% of Total Gross Profit 2.5%
3.0%
Online advertising expenses consist primarily of the costs of (1) search engine keyword purchases; (2) referrals from meta-search and travel research
websites; (3) affiliate programs; and (4) banner, pop-up and other Internet and mobile advertisements. For the year ended December 31, 2015 , online advertising
expenses increased 18.5% , compared to the year ended December 31, 2014 , primarily due to increased spending on online performance marketing to generate
increased gross bookings. Online advertising as a percentage of gross profit for the year ended December 31, 2015 benefited from the inclusion of OpenTable
because OpenTable spends a lower percentage of gross profit on online advertising relative to our other brands. In addition, the share of our business coming
directly to our websites with no associated online advertising expense increased during the year ended December 31, 2015 compared to the year ended
December 31, 2014 . These favorable impacts were more than offset for the year ended December 31, 2015 by a year-over-year decline in advertising ROIs.
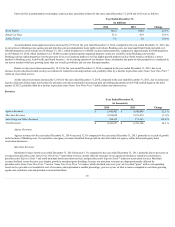
Offline advertising expenses are primarily related to our Booking.com, KAYAK and priceline.com businesses and primarily consist of television
advertising. For the year ended December 31, 2015 , offline advertising decreased 7.2% compared to the year ended December 31, 2014 , primarily due to lower
spending at KAYAK and, to a lesser extent, priceline.com.
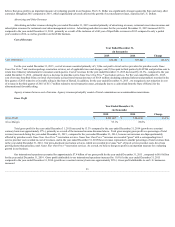
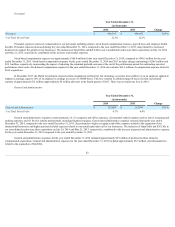
Sales and Marketing
Year Ended December 31,
(in thousands)
2015
2014
Change
Sales and Marketing $ 353,221
$ 310,910
13.6%
% of Total Gross Profit 4.1%
4.1%
Sales and marketing expenses consist primarily of (1) credit card processing fees associated with merchant transactions; (2) fees paid to third parties that
provide call center, website content translations and other services; (3) customer relations costs; (4) public relations costs; (5) provisions for bad debt, primarily
related to agency accommodation commission receivables; and (6) provisions for credit card chargebacks. For the year ended December 31, 2015 , sales and
marketing expenses, which are substantially variable in nature, increased compared to the year ended December 31, 2014 due primarily to increased gross booking
volumes, customer relations costs and the inclusion of a full year of OpenTable's results as compared to only a partial year's results in 2014.
54