Priceline 2015 Annual Report Download - page 114
Download and view the complete annual report
Please find page 114 of the 2015 Priceline annual report below. You can navigate through the pages in the report by either clicking on the pages listed below, or by using the keyword search tool below to find specific information within the annual report.-
 1
1 -
2
-
3
-
4
-
5
-
6
-
7
-
8
-
9
-
10
-
11
-
12
-
13
-
14
-
15
-
16
-
17
-
18
-
19
-
20
-
21
-
22
-
23
-
24
-
25
-
26
-
27
-
28
-
29
-
30
-
31
-
32
-
33
-
34
-
35
-
36
-
37
-
38
-
39
-
40
-
41
-
42
-
43
-
44
-
45
-
46
-
47
-
48
-
49
-
50
-
51
-
52
-
53
-
54
-
55
-
56
-
57
-
58
-
59
-
60
-
61
-
62
-
63
-
64
-
65
-
66
-
67
-
68
-
69
-
70
-
71
-
72
-
73
-
74
-
75
-
76
-
77
-
78
-
79
-
80
-
81
-
82
-
83
-
84
-
85
-
86
-
87
-
88
-
89
-
90
-
91
-
92
-
93
-
94
-
95
-
96
-
97
-
98
-
99
-
100
-
101
-
102
-
103
-
 104
104 -
 105
105 -
 106
106 -
 107
107 -
 108
108 -
 109
109 -
 110
110 -
 111
111 -
 112
112 -
 113
113 -
 114
114 -
 115
115 -
 116
116 -
 117
117 -
 118
118 -
 119
119 -
 120
120 -
 121
121 -
 122
122 -
 123
123 -
 124
124 -
125
-
126
-
127
-
128
-
129
-
130
-
131
-
132
-
133
-
134
-
135
-
136
-
137
-
138
-
139
-
140
-
141
-
142
-
143
-
144
-
145
 |
 |

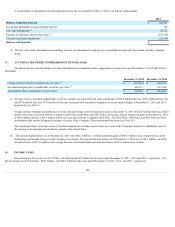
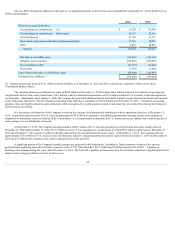
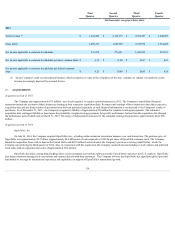
The tax effects of temporary differences that give rise to significant portions of deferred tax assets and liabilities at December 31, 2015 and 2014 are as
follows (in thousands):
2015
2014
Deferred tax assets/(liabilities):
Net operating loss carryforward — U.S. $ 59,220
$ 176,786
Net operating loss carryforward — International 18,153
22,353
Accrued expenses 61,703
41,117
Stock-based compensation and other stock based payments 77,761
54,935
Other 8,001
24,456
Subtotal 224,838
319,647
Discount on convertible notes (112,886)
(141,193)
Intangible assets and other (822,685)
(856,807)
Euro denominated debt (92,230)
(35,441)
Fixed assets (3,658)
(3,409)
Less valuation allowance on deferred tax assets (64,845)
(161,997)
Net deferred tax liabilities (1) $ (871,466)
$ (879,200)
(1) Includes deferred tax assets of $21.1 million and $20.9 million as of December 31, 2015 and 2014 , respectively, reported in "Other assets" in the
Consolidated Balance Sheets.
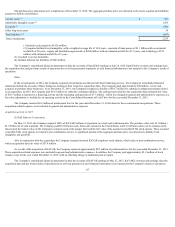
The valuation allowance on deferred tax assets of $64.8 million at December 31, 2015 includes $44.8 million related to U.S. federal net operating loss
carryforwards derived from equity transactions, $18.2 million related to international operations and $1.9 million related to U.S. research credits and capital loss
carryforwards. Additionally, since January 1, 2006, the Company has generated additional federal tax benefits related to equity transactions that are not included
in the deferred tax table above. The tax benefits not included in the table above amounted to $242.6 million as of December 31, 2015 . Pursuant to accounting
guidance, these tax benefits related to equity deductions will be recognized by crediting paid-in capital, if and when they are realized by reducing the Company's
current income tax liability.
It is the practice and intention of the Company to reinvest the earnings of its international subsidiaries in those operations; therefore, at December 31,
2015 , no provision had been made for U.S. taxes on approximately $9.9 billion of cumulative undistributed international earnings because such earnings are
intended to be indefinitely reinvested outside of the United States. It is not practicable to determine the U.S. federal income tax liability that would be payable if
such earnings were not indefinitely reinvested.
At December 31, 2015 , the Company has approximately $620.9 million of U.S. state net operating loss carryforwards that expire mainly between
December 31, 2020 and December 31, 2034, $122.5 million of non-U.S. net operating loss carryforwards, of which $49.0 million expire between December 31,
2019 and December 31, 2021, and $1.3 million of foreign capital allowance carryforwards that do not expire. At December 31, 2015 , the Company also had
approximately $32.4 million of U.S. research credit carryforwards, subject to annual limitation, that mainly expire between December 31, 2033 and December 31,
2034 and $2.0 million state enterprise zone credits expiring between 2024 and 2026.
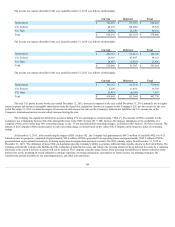
A significant portion of the Company's taxable earnings are generated in the Netherlands. According to Dutch corporate income tax law, income
generated from qualifying innovative activities is taxed at a rate of 5% ("Innovation Box Tax") rather than the Dutch statutory rate of 25% . A portion of
Booking.com's earnings during the years ended December 31, 2015 , 2014 and 2013 qualifies for Innovation Box Tax treatment, which had a significant beneficial
impact on the Company's effective tax rate for those years.
110