Priceline 2015 Annual Report Download - page 59
Download and view the complete annual report
Please find page 59 of the 2015 Priceline annual report below. You can navigate through the pages in the report by either clicking on the pages listed below, or by using the keyword search tool below to find specific information within the annual report.-
 1
1 -
2
-
3
-
4
-
5
-
6
-
7
-
8
-
9
-
10
-
11
-
12
-
13
-
14
-
15
-
16
-
17
-
18
-
19
-
20
-
21
-
22
-
23
-
24
-
25
-
26
-
27
-
28
-
29
-
30
-
31
-
32
-
33
-
34
-
35
-
36
-
37
-
38
-
39
-
40
-
41
-
42
-
43
-
44
-
45
-
46
-
47
-
48
-
 49
49 -
 50
50 -
 51
51 -
 52
52 -
 53
53 -
 54
54 -
 55
55 -
 56
56 -
 57
57 -
 58
58 -
 59
59 -
 60
60 -
 61
61 -
 62
62 -
 63
63 -
 64
64 -
 65
65 -
 66
66 -
 67
67 -
 68
68 -
 69
69 -
70
-
71
-
72
-
73
-
74
-
75
-
76
-
77
-
78
-
79
-
80
-
81
-
82
-
83
-
84
-
85
-
86
-
87
-
88
-
89
-
90
-
91
-
92
-
93
-
94
-
95
-
96
-
97
-
98
-
99
-
100
-
101
-
102
-
103
-
104
-
105
-
106
-
107
-
108
-
109
-
110
-
111
-
112
-
113
-
114
-
115
-
116
-
117
-
118
-
119
-
120
-
121
-
122
-
123
-
124
-
125
-
126
-
127
-
128
-
129
-
130
-
131
-
132
-
133
-
134
-
135
-
136
-
137
-
138
-
139
-
140
-
141
-
142
-
143
-
144
-
145
 |
 |

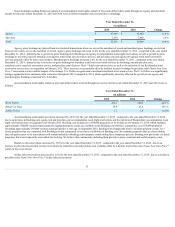
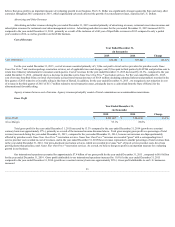
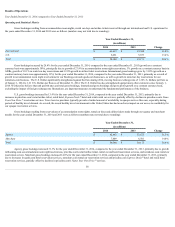
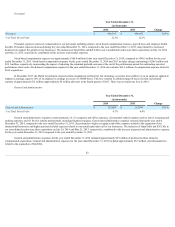
Depreciation and Amortization
Year Ended December 31,
(in thousands)
2015
2014
Change
Depreciation and Amortization $ 272,494
$ 207,820
31.1%
% of Total Gross Profit 3.2%
2.7%
Depreciation and amortization expenses consist of: (1) amortization of intangible assets with determinable lives; (2) depreciation on computer equipment;
(3) depreciation of internally developed and purchased software; and (4) depreciation of leasehold improvements, furniture and fixtures and office equipment. For
the year ended December 31, 2015 , depreciation and amortization expense increased, compared to the year ended December 31, 2014 , due primarily to increased
intangible amortization from the OpenTable acquisition and increased depreciation expense due to capital expenditures for additional data center capacity and
office build-outs to support growth and geographic expansion, principally related to our Booking.com business. Additionally, the inclusion of OpenTable in our
consolidated results since its acquisition on July 24, 2014 contributed to the increase in depreciation expense for the year ended December 31, 2015 compared to
the year ended December 31, 2014 .
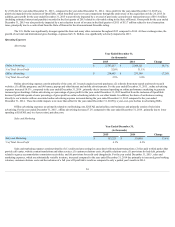
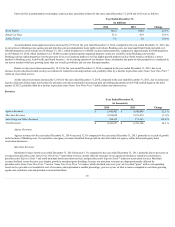
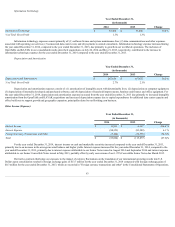
Other Income (Expense)
Year Ended December 31,
(in thousands)
2015
2014
Change
Interest Income $ 55,729
$ 13,933
300.0%
Interest Expense (160,229)
(88,353)
81.4%
Foreign Currency Transactions and Other (26,087)
(9,444)
176.2%
Total $ (130,587)
$ (83,864)
55.7%
For the year ended December 31, 2015 , interest income on cash and marketable securities increased compared to the year ended December 31, 2014 ,
primarily due to an increase in the average invested balance and higher yields. Interest expense increased for the year ended December 31, 2015 , compared to the
year ended December 31, 2014 , primarily due to interest expense attributable to our Senior Notes issued in August 2014, September 2014, March 2015 and
November 2015, partially offset by the maturity of our 1.25% Convertible Senior Notes in March 2015. See Note 10 to our Consolidated Financial Statements.
Derivative contracts that hedge our exposure to the impact of currency fluctuations on the translation of our international operating results into U.S.
Dollars upon consolidation resulted in foreign exchange losses of $6.6 million for the year ended December 31, 2015 compared to foreign exchange gains of $13.7
million for the year ended December 31, 2014 , and are recorded in "Foreign currency transactions and other" in the Consolidated Statements of Operations.
Foreign exchange transaction losses, including costs related to foreign exchange transactions, resulted in losses of $21.0 million for the year ended
December 31, 2015 , which includes approximately $5.7 million of hedging cost and a foreign exchange loss recorded in the fourth quarter of 2015 related to the
devaluation of the Argentine Peso, compared to foreign exchange losses of $17.6 million for the year ended December 31, 2014 , and are recorded in "Foreign
currency transactions and other" in the Consolidated Statements of Operations.
For the year ended December 31, 2015 , we recognized $2.2 million of net realized gains related to investments, which are recorded in "Foreign currency
transactions and other" in the Consolidated Statement of Operations.
The conversion of our convertible debt prior to maturity in the year ended December 31, 2014 resulted in non-cash losses of $6.3 million , which are
recorded in "Foreign currency transactions and other" in the Consolidated Statement of Operations.
56