Priceline 2015 Annual Report Download - page 56
Download and view the complete annual report
Please find page 56 of the 2015 Priceline annual report below. You can navigate through the pages in the report by either clicking on the pages listed below, or by using the keyword search tool below to find specific information within the annual report.-
 1
1 -
2
-
3
-
4
-
5
-
6
-
7
-
8
-
9
-
10
-
11
-
12
-
13
-
14
-
15
-
16
-
17
-
18
-
19
-
20
-
21
-
22
-
23
-
24
-
25
-
26
-
27
-
28
-
29
-
30
-
31
-
32
-
33
-
34
-
35
-
36
-
37
-
38
-
39
-
40
-
41
-
42
-
43
-
44
-
45
-
 46
46 -
 47
47 -
 48
48 -
 49
49 -
 50
50 -
 51
51 -
 52
52 -
 53
53 -
 54
54 -
 55
55 -
 56
56 -
 57
57 -
 58
58 -
 59
59 -
 60
60 -
 61
61 -
 62
62 -
 63
63 -
 64
64 -
 65
65 -
 66
66 -
67
-
68
-
69
-
70
-
71
-
72
-
73
-
74
-
75
-
76
-
77
-
78
-
79
-
80
-
81
-
82
-
83
-
84
-
85
-
86
-
87
-
88
-
89
-
90
-
91
-
92
-
93
-
94
-
95
-
96
-
97
-
98
-
99
-
100
-
101
-
102
-
103
-
104
-
105
-
106
-
107
-
108
-
109
-
110
-
111
-
112
-
113
-
114
-
115
-
116
-
117
-
118
-
119
-
120
-
121
-
122
-
123
-
124
-
125
-
126
-
127
-
128
-
129
-
130
-
131
-
132
-
133
-
134
-
135
-
136
-
137
-
138
-
139
-
140
-
141
-
142
-
143
-
144
-
145
 |
 |

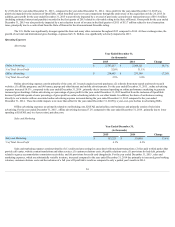
believe that gross profit is an important measure of evaluating growth in our business. The U.S. Dollar was significantly stronger against the Euro and many other
currencies throughout 2015 compared to 2014 , which significantly adversely affected the growth of our merchant revenues, expressed in U.S. Dollars.
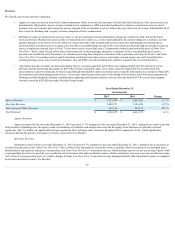
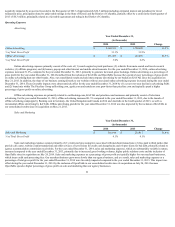
Advertising and Other Revenues
Advertising and other revenues during the year ended December 31, 2015 consisted primarily of advertising revenues, restaurant reservation revenues and
subscription revenues for restaurant reservation management services. Advertising and other revenues for the year ended December 31, 2015 increased 49.5%
compared to the year ended December 31, 2014 , primarily as a result of the inclusion of a full year of OpenTable revenues in 2015 compared to only a partial
year's results in 2014, as well as growth in our KAYAK business.
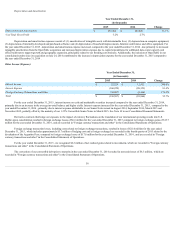
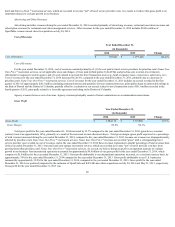
Cost of Revenues
Year Ended December 31,
(in thousands)
2015
2014
Change
Cost of Revenues $ 632,180
$ 857,841
(26.3)%
For the year ended December 31, 2015 , cost of revenues consisted primarily of: (1) the cost paid to travel service providers for priceline.com's Name
Your Own Price ® and vacation package reservation services, net of applicable taxes and charges; and (2) fees paid to third parties by KAYAK and priceline.com to
return travel itinerary information for consumer search queries. Cost of revenues for the year ended December 31, 2015 decreased by 26.3% , compared to the year
ended December 31, 2014 , primarily due to a decrease in priceline.com's Name Your Own Price ® reservation services. For the year ended December 31, 2015 ,
cost of revenue benefited from a reversal of previously accrued travel transaction taxes of $16.4 million (including estimated interest and penalties) recorded in the
first quarter of 2015 related to a favorable ruling in the State of Hawaii. In addition, for the year ended December 31, 2015 , we recognized a net reduction in cost
of revenue in the third quarter of 2015 of $13.7 million related to travel transaction taxes, principally due to a cash refund from the State of Hawaii for the
aforementioned favorable ruling.
Agency revenues have no cost of revenue. Agency revenues principally consist of travel commissions on accommodation reservations.
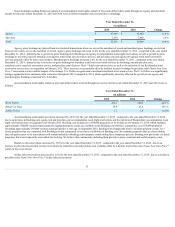
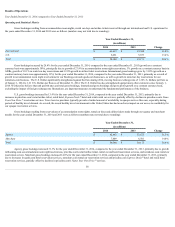
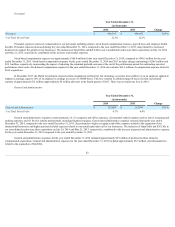
Gross Profit
Year Ended December 31,
(in thousands)
2015
2014
Change
Gross Profit $ 8,591,807
$ 7,584,130
13.3%
Gross Margin 93.1%
89.8%
Total gross profit for the year ended December 31, 2015 increased by 13.3% compared to the year ended December 31, 2014 (growth on a constant
currency basis was approximately 27% ), primarily as a result of the increased revenue discussed above. Total gross margin (gross profit as a percentage of total
revenue) increased during the year ended December 31, 2015 , compared to the year ended December 31, 2014 , because our revenues are disproportionately
affected by priceline.com's Name Your Own Price ® reservation services. Name Your Own Price ® revenues are recorded "gross" with a corresponding travel
service provider cost recorded in cost of revenues, and in the year ended December 31, 2015 these revenues represented a smaller percentage of total revenues than
in the year ended December 31, 2014 . Our price-disclosed reservation services, which are recorded in revenue "net" of travel service provider costs, have been
growing faster than priceline.com's Name Your Own Price ® reservation services. As a result, we believe that gross profit is an important measure for evaluating
growth in our business.
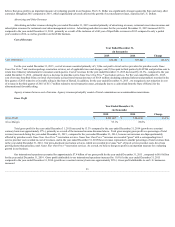
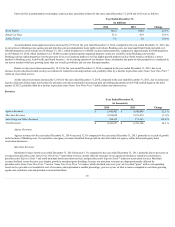
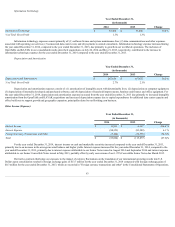
Our international operations accounted for approximately $7.4 billion of our gross profit for the year ended December 31, 2015 , compared to $6.6 billion
for the year ended December 31, 2014 . Gross profit attributable to our international operations increased by 11.6% for the year ended December 31, 2015
compared to the year ended December 31, 2014 (growth on a constant currency basis was approximately 28% ). Gross profit attributable to our U.S. businesses
increased
53