Priceline 2015 Annual Report Download - page 86
Download and view the complete annual report
Please find page 86 of the 2015 Priceline annual report below. You can navigate through the pages in the report by either clicking on the pages listed below, or by using the keyword search tool below to find specific information within the annual report.-
 1
1 -
2
-
3
-
4
-
5
-
6
-
7
-
8
-
9
-
10
-
11
-
12
-
13
-
14
-
15
-
16
-
17
-
18
-
19
-
20
-
21
-
22
-
23
-
24
-
25
-
26
-
27
-
28
-
29
-
30
-
31
-
32
-
33
-
34
-
35
-
36
-
37
-
38
-
39
-
40
-
41
-
42
-
43
-
44
-
45
-
46
-
47
-
48
-
49
-
50
-
51
-
52
-
53
-
54
-
55
-
56
-
57
-
58
-
59
-
60
-
61
-
62
-
63
-
64
-
65
-
66
-
67
-
68
-
69
-
70
-
71
-
72
-
73
-
74
-
75
-
 76
76 -
 77
77 -
 78
78 -
 79
79 -
 80
80 -
 81
81 -
 82
82 -
 83
83 -
 84
84 -
 85
85 -
 86
86 -
 87
87 -
 88
88 -
 89
89 -
 90
90 -
 91
91 -
 92
92 -
 93
93 -
 94
94 -
 95
95 -
 96
96 -
97
-
98
-
99
-
100
-
101
-
102
-
103
-
104
-
105
-
106
-
107
-
108
-
109
-
110
-
111
-
112
-
113
-
114
-
115
-
116
-
117
-
118
-
119
-
120
-
121
-
122
-
123
-
124
-
125
-
126
-
127
-
128
-
129
-
130
-
131
-
132
-
133
-
134
-
135
-
136
-
137
-
138
-
139
-
140
-
141
-
142
-
143
-
144
-
145
 |
 |

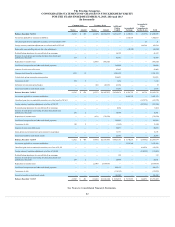
The Priceline Group Inc.
CONSOLIDATED STATEMENTS OF CASH FLOWS
(In thousands)
Year Ended December 31,
2015
2014
See Note 2
2013
See Note 2
OPERATING ACTIVITIES:
Net income $ 2,551,360
$ 2,421,753
$ 1,892,798
Adjustments to reconcile net income to net cash provided by operating activities:
Depreciation 101,517
78,241
48,365
Amortization 170,977
129,579
69,610
Provision for uncollectible accounts, net 24,324
22,990
16,451
Deferred income tax expense (benefit) (61,335)
31,707
(11,104)
Stock-based compensation expense and other stock-based payments 249,133
189,292
142,098
Amortization of debt issuance costs 7,578
5,229
7,898
Amortization of debt discount 66,687
54,731
55,718
Loss on early extinguishment of debt 3
6,270
26,661
Changes in assets and liabilities:
Accounts receivable (68,694)
(182,209)
(111,572)
Prepaid expenses and other current assets (81,611)
(48,932)
(6,909)
Accounts payable, accrued expenses and other current liabilities 166,201
203,870
182,163
Other (23,909)
1,876
(10,741)
Net cash provided by operating activities 3,102,231
2,914,397
2,301,436
INVESTING ACTIVITIES:
Purchase of investments (8,669,690)
(10,552,214)
(9,955,800)
Proceeds from sale of investments 5,084,238
10,902,500
8,291,283
Additions to property and equipment (173,915)
(131,504)
(84,445)
Acquisitions and other equity investments, net of cash acquired (140,338)
(2,496,366)
(331,918)
Proceeds from foreign currency contracts 453,818
14,354
3,266
Payments on foreign currency contracts (448,640)
(94,661)
(81,870)
Change in restricted cash 9
9,347
(2,783)
Net cash used in investing activities (3,894,518)
(2,348,544)
(2,162,267)
FINANCING ACTIVITIES:
Proceeds from revolving credit facility 225,000
995,000
—
Payments related to revolving credit facility (225,000)
(995,000)
—
Proceeds from the issuance of long-term debt 2,399,034
2,264,753
978,982
Payment of debt issuance costs - revolving credit facility (4,005)
—
—
Payments related to conversion of senior notes (147,629)
(125,136)
(414,569)
Repurchase of common stock (3,089,055)
(750,378)
(883,515)
Payments of contingent consideration (10,700)
—
—
Payments to purchase subsidiary shares from noncontrolling interests —
—
(192,530)
Payments of stock issuance costs —
—
(1,191)
Proceeds from exercise of stock options 20,851
16,389
91,607
Proceeds from the termination of conversion spread hedges —
—
19
Excess tax benefits on stock-based awards 101,508
23,366
17,686
Net cash (used in) provided by financing activities (729,996)
1,428,994
(403,511)
Effect of exchange rate changes on cash and cash equivalents (149,103)
(136,190)
17,987
Net (decrease) increase in cash and cash equivalents (1,671,386)
1,858,657
(246,355)
Cash and cash equivalents, beginning of period 3,148,651
1,289,994
1,536,349
Cash and cash equivalents, end of period $ 1,477,265
$ 3,148,651
$ 1,289,994
SUPPLEMENTAL CASH FLOW INFORMATION:
Cash paid during the period for income taxes $ 534,105
$ 491,530
$ 391,169
Cash paid during the period for interest $ 54,299
$ 16,950
$ 20,954