Priceline 2015 Annual Report Download - page 82
Download and view the complete annual report
Please find page 82 of the 2015 Priceline annual report below. You can navigate through the pages in the report by either clicking on the pages listed below, or by using the keyword search tool below to find specific information within the annual report.-
 1
1 -
2
-
3
-
4
-
5
-
6
-
7
-
8
-
9
-
10
-
11
-
12
-
13
-
14
-
15
-
16
-
17
-
18
-
19
-
20
-
21
-
22
-
23
-
24
-
25
-
26
-
27
-
28
-
29
-
30
-
31
-
32
-
33
-
34
-
35
-
36
-
37
-
38
-
39
-
40
-
41
-
42
-
43
-
44
-
45
-
46
-
47
-
48
-
49
-
50
-
51
-
52
-
53
-
54
-
55
-
56
-
57
-
58
-
59
-
60
-
61
-
62
-
63
-
64
-
65
-
66
-
67
-
68
-
69
-
70
-
71
-
 72
72 -
 73
73 -
 74
74 -
 75
75 -
 76
76 -
 77
77 -
 78
78 -
 79
79 -
 80
80 -
 81
81 -
 82
82 -
 83
83 -
 84
84 -
 85
85 -
 86
86 -
 87
87 -
 88
88 -
 89
89 -
 90
90 -
 91
91 -
 92
92 -
93
-
94
-
95
-
96
-
97
-
98
-
99
-
100
-
101
-
102
-
103
-
104
-
105
-
106
-
107
-
108
-
109
-
110
-
111
-
112
-
113
-
114
-
115
-
116
-
117
-
118
-
119
-
120
-
121
-
122
-
123
-
124
-
125
-
126
-
127
-
128
-
129
-
130
-
131
-
132
-
133
-
134
-
135
-
136
-
137
-
138
-
139
-
140
-
141
-
142
-
143
-
144
-
145
 |
 |

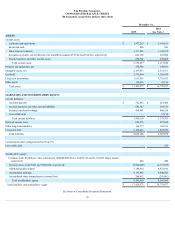
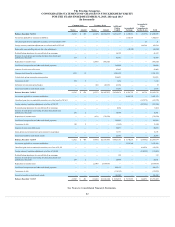
The Priceline Group Inc.
CONSOLIDATED BALANCE SHEETS
(In thousands, except share and per share data)
December 31,
2015
2014
See Note 2
ASSETS
Current assets:
Cash and cash equivalents
$ 1,477,265
$ 3,148,651
Restricted cash
806
843
Short-term investments
1,171,246
1,142,182
Accounts receivable, net of allowance for doubtful accounts of $15,014 and $14,212, respectively
645,169
643,894
Prepaid expenses and other current assets
258,751
178,050
Total current assets
3,553,237
5,113,620
Property and equipment, net
274,786
198,953
Intangible assets, net
2,167,533
2,334,761
Goodwill
3,375,000
3,326,474
Long-term investments
7,931,363
3,755,653
Other assets
118,656
41,516
Total assets
$ 17,420,575
$ 14,770,977
LIABILITIES AND STOCKHOLDERS' EQUITY
Current liabilities:
Accounts payable
$ 322,842
$ 281,480
Accrued expenses and other current liabilities
681,587
599,515
Deferred merchant bookings
434,881
460,558
Convertible debt
—
37,150
Total current liabilities
1,439,310
1,378,703
Deferred income taxes
892,576
897,848
Other long-term liabilities
134,777
103,533
Long-term debt
6,158,443
3,823,870
Total liabilities
8,625,106
6,203,954
Commitments and Contingencies (See Note 15)
Convertible debt
—
329
Stockholders' equity:
Common stock, $0.008 par value, authorized 1,000,000,000 shares, 62,039,516 and 61,821,097 shares issued,
respectively
482
480
Treasury stock, 12,427,945 and 9,888,024, respectively
(5,826,640)
(2,737,585)
Additional paid-in capital
5,184,910
4,923,196
Accumulated earnings
9,191,865
6,640,505
Accumulated other comprehensive income (loss)
244,852
(259,902)
Total stockholders' equity
8,795,469
8,566,694
Total liabilities and stockholders' equity
$ 17,420,575
$ 14,770,977
See Notes to Consolidated Financial Statements.
79