Priceline 2015 Annual Report Download - page 38
Download and view the complete annual report
Please find page 38 of the 2015 Priceline annual report below. You can navigate through the pages in the report by either clicking on the pages listed below, or by using the keyword search tool below to find specific information within the annual report.-
 1
1 -
2
-
3
-
4
-
5
-
6
-
7
-
8
-
9
-
10
-
11
-
12
-
13
-
14
-
15
-
16
-
17
-
18
-
19
-
20
-
21
-
22
-
23
-
24
-
25
-
26
-
27
-
 28
28 -
 29
29 -
 30
30 -
 31
31 -
 32
32 -
 33
33 -
 34
34 -
 35
35 -
 36
36 -
 37
37 -
 38
38 -
 39
39 -
 40
40 -
 41
41 -
 42
42 -
 43
43 -
 44
44 -
 45
45 -
 46
46 -
 47
47 -
 48
48 -
49
-
50
-
51
-
52
-
53
-
54
-
55
-
56
-
57
-
58
-
59
-
60
-
61
-
62
-
63
-
64
-
65
-
66
-
67
-
68
-
69
-
70
-
71
-
72
-
73
-
74
-
75
-
76
-
77
-
78
-
79
-
80
-
81
-
82
-
83
-
84
-
85
-
86
-
87
-
88
-
89
-
90
-
91
-
92
-
93
-
94
-
95
-
96
-
97
-
98
-
99
-
100
-
101
-
102
-
103
-
104
-
105
-
106
-
107
-
108
-
109
-
110
-
111
-
112
-
113
-
114
-
115
-
116
-
117
-
118
-
119
-
120
-
121
-
122
-
123
-
124
-
125
-
126
-
127
-
128
-
129
-
130
-
131
-
132
-
133
-
134
-
135
-
136
-
137
-
138
-
139
-
140
-
141
-
142
-
143
-
144
-
145
 |
 |
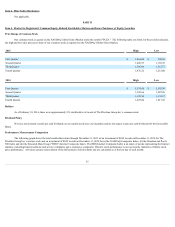
Item 4. Mine Safety Disclosures
Not applicable.
PART II
Item 5. Market for Registrant's Common Equity, Related Stockholder Matters and Issuer Purchases of Equity Securities
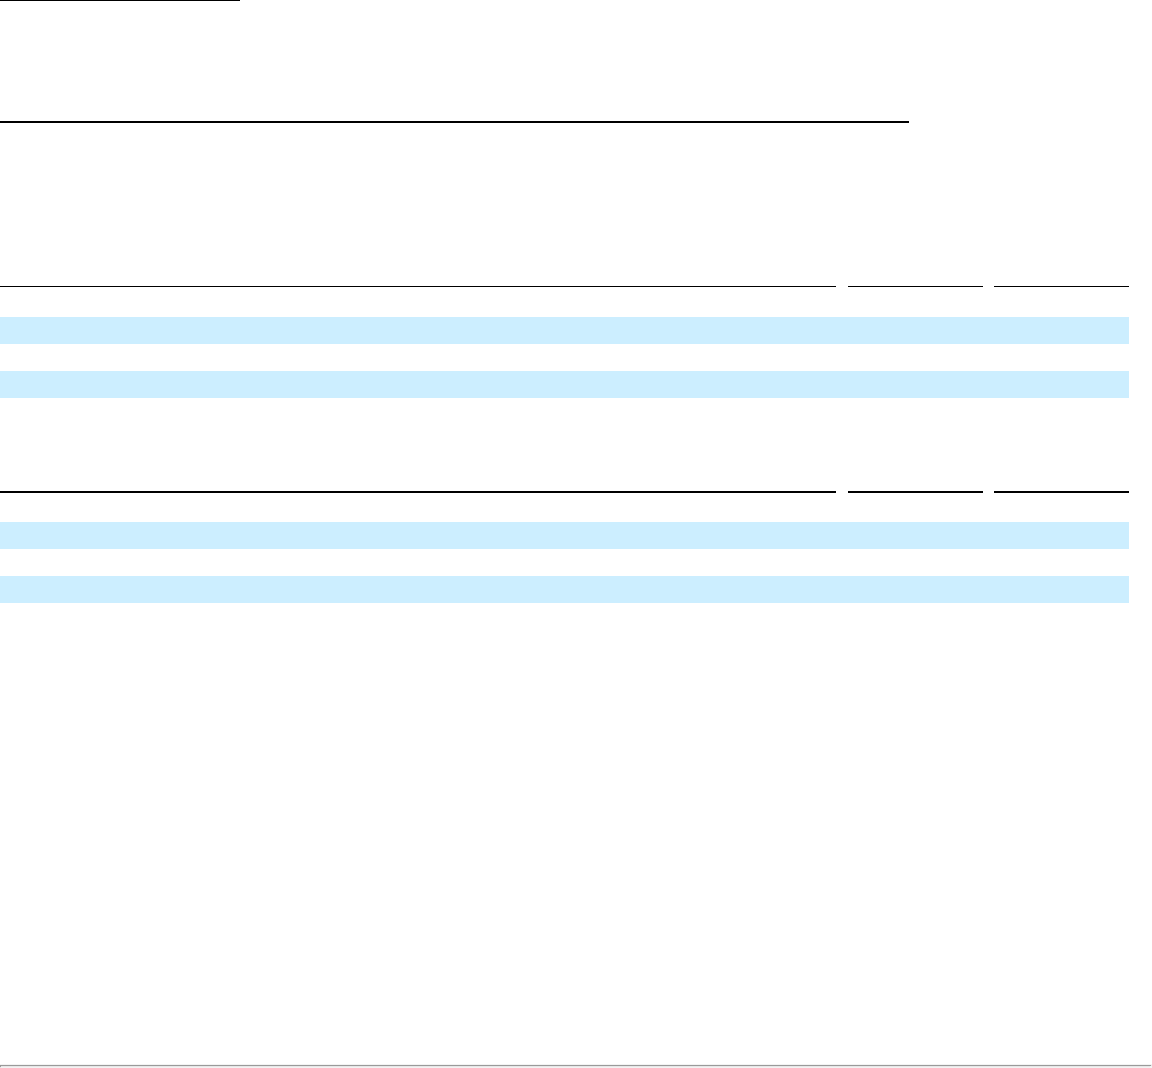
Price Range of Common Stock
Our common stock is quoted on the NASDAQ Global Select Market under the symbol "PCLN." The following table sets forth, for the periods indicated,
the high and low sales prices per share of our common stock as reported on the NASDAQ Global Select Market:
2015
High
Low
First Quarter
$ 1,264.00
$ 990.69
Second Quarter
1,280.97
1,103.45
Third Quarter
1,395.00
1,115.77
Fourth Quarter
1,476.52
1,212.00
2014
High
Low
First Quarter
$ 1,378.96
$ 1,103.90
Second Quarter
1,292.66
1,087.26
Third Quarter
1,329.90
1,139.27
Fourth Quarter
1,229.00
1,017.28
Holders
As of February 10, 2016, there were approximately 213 stockholders of record of The Priceline Group Inc.'s common stock.
Dividend Policy
We have not declared or paid any cash dividends on our capital stock since our inception and do not expect to pay any cash dividends for the foreseeable
future.
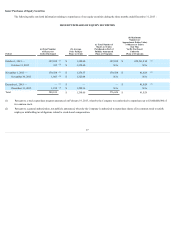
Performance Measurement Comparison
The following graph shows the total stockholder return through December 31, 2015 of an investment of $100 in cash on December 31, 2010 for The
Priceline Group Inc. common stock and an investment of $100 in cash on December 31, 2010 for (i) the NASDAQ Composite Index, (ii) the Standard and Poor's
500 Index and (iii) the Research Data Group ("RDG") Internet Composite Index. The RDG Internet Composite Index is an index of stocks representing the Internet
industry, including Internet software and service companies and e-commerce companies. Historic stock performance is not necessarily indicative of future stock
price performance. All values assume reinvestment of the full amount of all dividends and are calculated as of the last day of each month:
35