Priceline 2015 Annual Report Download - page 101
Download and view the complete annual report
Please find page 101 of the 2015 Priceline annual report below. You can navigate through the pages in the report by either clicking on the pages listed below, or by using the keyword search tool below to find specific information within the annual report.-
 1
1 -
2
-
3
-
4
-
5
-
6
-
7
-
8
-
9
-
10
-
11
-
12
-
13
-
14
-
15
-
16
-
17
-
18
-
19
-
20
-
21
-
22
-
23
-
24
-
25
-
26
-
27
-
28
-
29
-
30
-
31
-
32
-
33
-
34
-
35
-
36
-
37
-
38
-
39
-
40
-
41
-
42
-
43
-
44
-
45
-
46
-
47
-
48
-
49
-
50
-
51
-
52
-
53
-
54
-
55
-
56
-
57
-
58
-
59
-
60
-
61
-
62
-
63
-
64
-
65
-
66
-
67
-
68
-
69
-
70
-
71
-
72
-
73
-
74
-
75
-
76
-
77
-
78
-
79
-
80
-
81
-
82
-
83
-
84
-
85
-
86
-
87
-
88
-
89
-
90
-
 91
91 -
 92
92 -
 93
93 -
 94
94 -
 95
95 -
 96
96 -
 97
97 -
 98
98 -
 99
99 -
 100
100 -
 101
101 -
 102
102 -
 103
103 -
 104
104 -
 105
105 -
 106
106 -
 107
107 -
 108
108 -
 109
109 -
 110
110 -
 111
111 -
112
-
113
-
114
-
115
-
116
-
117
-
118
-
119
-
120
-
121
-
122
-
123
-
124
-
125
-
126
-
127
-
128
-
129
-
130
-
131
-
132
-
133
-
134
-
135
-
136
-
137
-
138
-
139
-
140
-
141
-
142
-
143
-
144
-
145
 |
 |

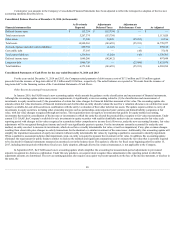
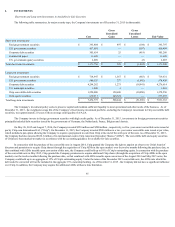
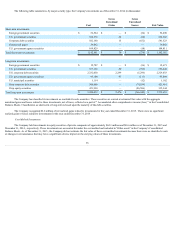
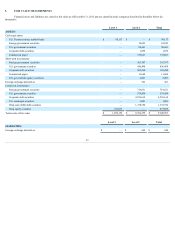
5. FAIR VALUE MEASUREMENTS
Financial assets and liabilities are carried at fair value as of December 31, 2015 and are classified in the categories described in the tables below (in
thousands):
Level 1
Level 2
Total
ASSETS:
Cash equivalents:
U.S. Treasury money market funds
$ 99,117
$ —
$ 99,117
Foreign government securities
—
10,659
10,659
U.S. government securities
—
90,441
90,441
Corporate debt securities
—
1,855
1,855
Commercial paper
—
335,663
335,663
Short-term investments:
Foreign government securities
—
395,797
395,797
U.S. government securities
—
456,494
456,494
Corporate debt securities
—
305,260
305,260
Commercial paper
—
11,688
11,688
U.S. government agency securities
—
2,007
2,007
Foreign exchange derivatives
—
363
363
Long-term investments:
Foreign government securities
—
719,631
719,631
U.S. government securities
—
578,450
578,450
Corporate debt securities
—
4,276,614
4,276,614
U.S. municipal securities
—
1,083
1,083
Ctrip convertible debt securities
—
1,378,550
1,378,550
Ctrip equity securities
977,035
—
977,035
Total assets at fair value
$ 1,076,152
$ 8,564,555
$ 9,640,707
Level 1
Level 2
Total
LIABILITIES:
Foreign exchange derivatives
$ —
$ 644
$ 644
97