Priceline 2015 Annual Report Download - page 119
Download and view the complete annual report
Please find page 119 of the 2015 Priceline annual report below. You can navigate through the pages in the report by either clicking on the pages listed below, or by using the keyword search tool below to find specific information within the annual report.-
 1
1 -
2
-
3
-
4
-
5
-
6
-
7
-
8
-
9
-
10
-
11
-
12
-
13
-
14
-
15
-
16
-
17
-
18
-
19
-
20
-
21
-
22
-
23
-
24
-
25
-
26
-
27
-
28
-
29
-
30
-
31
-
32
-
33
-
34
-
35
-
36
-
37
-
38
-
39
-
40
-
41
-
42
-
43
-
44
-
45
-
46
-
47
-
48
-
49
-
50
-
51
-
52
-
53
-
54
-
55
-
56
-
57
-
58
-
59
-
60
-
61
-
62
-
63
-
64
-
65
-
66
-
67
-
68
-
69
-
70
-
71
-
72
-
73
-
74
-
75
-
76
-
77
-
78
-
79
-
80
-
81
-
82
-
83
-
84
-
85
-
86
-
87
-
88
-
89
-
90
-
91
-
92
-
93
-
94
-
95
-
96
-
97
-
98
-
99
-
100
-
101
-
102
-
103
-
104
-
105
-
106
-
107
-
108
-
 109
109 -
 110
110 -
 111
111 -
 112
112 -
 113
113 -
 114
114 -
 115
115 -
 116
116 -
 117
117 -
 118
118 -
 119
119 -
 120
120 -
 121
121 -
 122
122 -
 123
123 -
 124
124 -
 125
125 -
 126
126 -
 127
127 -
 128
128 -
 129
129 -
130
-
131
-
132
-
133
-
134
-
135
-
136
-
137
-
138
-
139
-
140
-
141
-
142
-
143
-
144
-
145
 |
 |

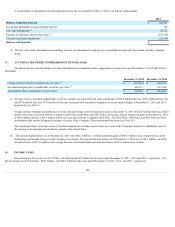
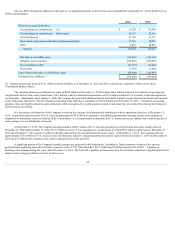
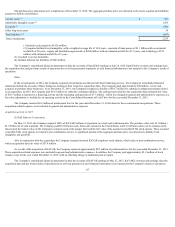
contributions during the years ended December 31, 2015 , 2014 and 2013 were approximately $8.4 million , $6.2 million and $5.8 million , respectively.
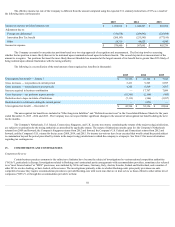
17 . GEOGRAPHIC INFORMATION
The Company's international information consists of the results of Booking.com, agoda.com and rentalcars.com and the results of the internationally-
based websites of KAYAK since May 21, 2013 and OpenTable since July 24, 2014 (in each case regardless of where the consumer resides, where the consumer is
physically located while making a reservation or the location of the travel service provider or restaurant). The Company's geographic information is as follows (in
thousands):
United
States
The
Netherlands
Other
Total
Company
2015
Revenues $ 1,817,360
$ 6,205,116
$ 1,201,511
$ 9,223,987
Intangible assets, net 2,052,351
78,027
37,155
2,167,533
Goodwill 2,742,535
232,982
399,483
3,375,000
Other long-lived assets 89,656
138,329
103,142
331,127
2014
Revenues $ 1,798,484
$ 5,519,207
$ 1,124,280
$ 8,441,971
Intangible assets, net 2,183,957
108,650
42,154
2,334,761
Goodwill 2,712,479
224,731
389,264
3,326,474
Other long-lived assets 80,668
97,056
77,915
255,639
2013
Revenues $ 1,769,696
$ 4,103,393
$ 920,217
$ 6,793,306
Intangible assets, net 838,494
123,847
57,644
1,019,985
Goodwill 1,247,686
156,261
363,965
1,767,912
Other long-lived assets 49,750
61,164
64,708
175,622
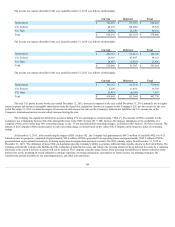
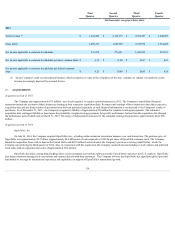
18 . SELECTED QUARTERLY FINANCIAL DATA (UNAUDITED)
First
Quarter
Second
Quarter
Third
Quarter
Fourth
Quarter
(In thousands, except per share data)
2015
Total revenues (1) $ 1,840,694
$ 2,280,397
$ 3,102,901
$ 1,999,995
Gross profit 1,672,236
2,092,906
2,947,282
1,879,383
Net income applicable to common stockholders 333,327
517,032
1,196,732
504,269
Net income applicable to common stockholders per basic common share $ 6.42
$ 10.02
$ 23.67
$ 10.14
Net income applicable to common stockholders per diluted common
share $ 6.36
$ 9.94
$ 23.41
$ 10.00
115