Priceline 2015 Annual Report Download - page 105
Download and view the complete annual report
Please find page 105 of the 2015 Priceline annual report below. You can navigate through the pages in the report by either clicking on the pages listed below, or by using the keyword search tool below to find specific information within the annual report.-
 1
1 -
2
-
3
-
4
-
5
-
6
-
7
-
8
-
9
-
10
-
11
-
12
-
13
-
14
-
15
-
16
-
17
-
18
-
19
-
20
-
21
-
22
-
23
-
24
-
25
-
26
-
27
-
28
-
29
-
30
-
31
-
32
-
33
-
34
-
35
-
36
-
37
-
38
-
39
-
40
-
41
-
42
-
43
-
44
-
45
-
46
-
47
-
48
-
49
-
50
-
51
-
52
-
53
-
54
-
55
-
56
-
57
-
58
-
59
-
60
-
61
-
62
-
63
-
64
-
65
-
66
-
67
-
68
-
69
-
70
-
71
-
72
-
73
-
74
-
75
-
76
-
77
-
78
-
79
-
80
-
81
-
82
-
83
-
84
-
85
-
86
-
87
-
88
-
89
-
90
-
91
-
92
-
93
-
94
-
 95
95 -
 96
96 -
 97
97 -
 98
98 -
 99
99 -
 100
100 -
 101
101 -
 102
102 -
 103
103 -
 104
104 -
 105
105 -
 106
106 -
 107
107 -
 108
108 -
 109
109 -
 110
110 -
 111
111 -
 112
112 -
 113
113 -
 114
114 -
 115
115 -
116
-
117
-
118
-
119
-
120
-
121
-
122
-
123
-
124
-
125
-
126
-
127
-
128
-
129
-
130
-
131
-
132
-
133
-
134
-
135
-
136
-
137
-
138
-
139
-
140
-
141
-
142
-
143
-
144
-
145
 |
 |
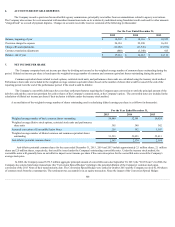
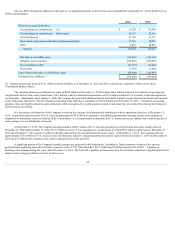
was anti-dilutive, it was excluded from the calculation of net income per share until the shares of common stock were received in October 2013.
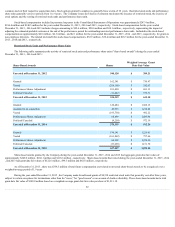
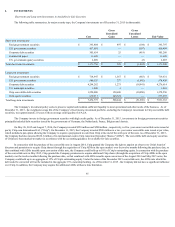
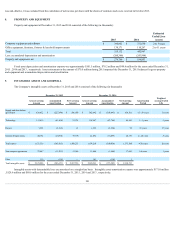
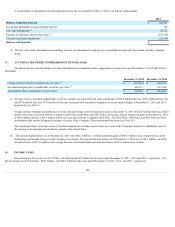
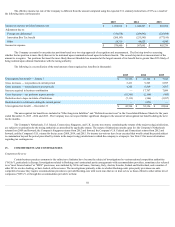
8. PROPERTY AND EQUIPMENT
Property and equipment at December 31, 2015 and 2014 consisted of the following (in thousands):
2015
2014
Estimated
Useful Lives
(years)
Computer equipment and software $ 396,961
$ 332,650
2 to 5 years
Office equipment, furniture, fixtures & leasehold improvements 138,171
110,297
2 to 11 years
Total 535,132
442,947
Less: accumulated depreciation and amortization (260,346)
(243,994)
Property and equipment, net $ 274,786
$ 198,953
Fixed asset depreciation and amortization expense was approximately $101.5 million , $78.2 million and $48.4 million for the years ended December 31,
2015 , 2014 and 2013 , respectively. Asset retirements in the amount of $75.0 million during 2015 impacted the December 31, 2015 balances for gross property
and equipment and accumulated depreciation and amortization.
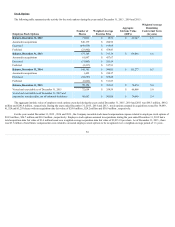
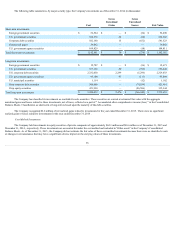
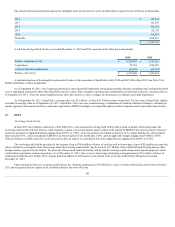
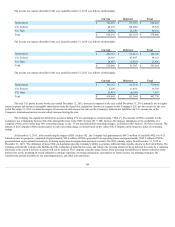
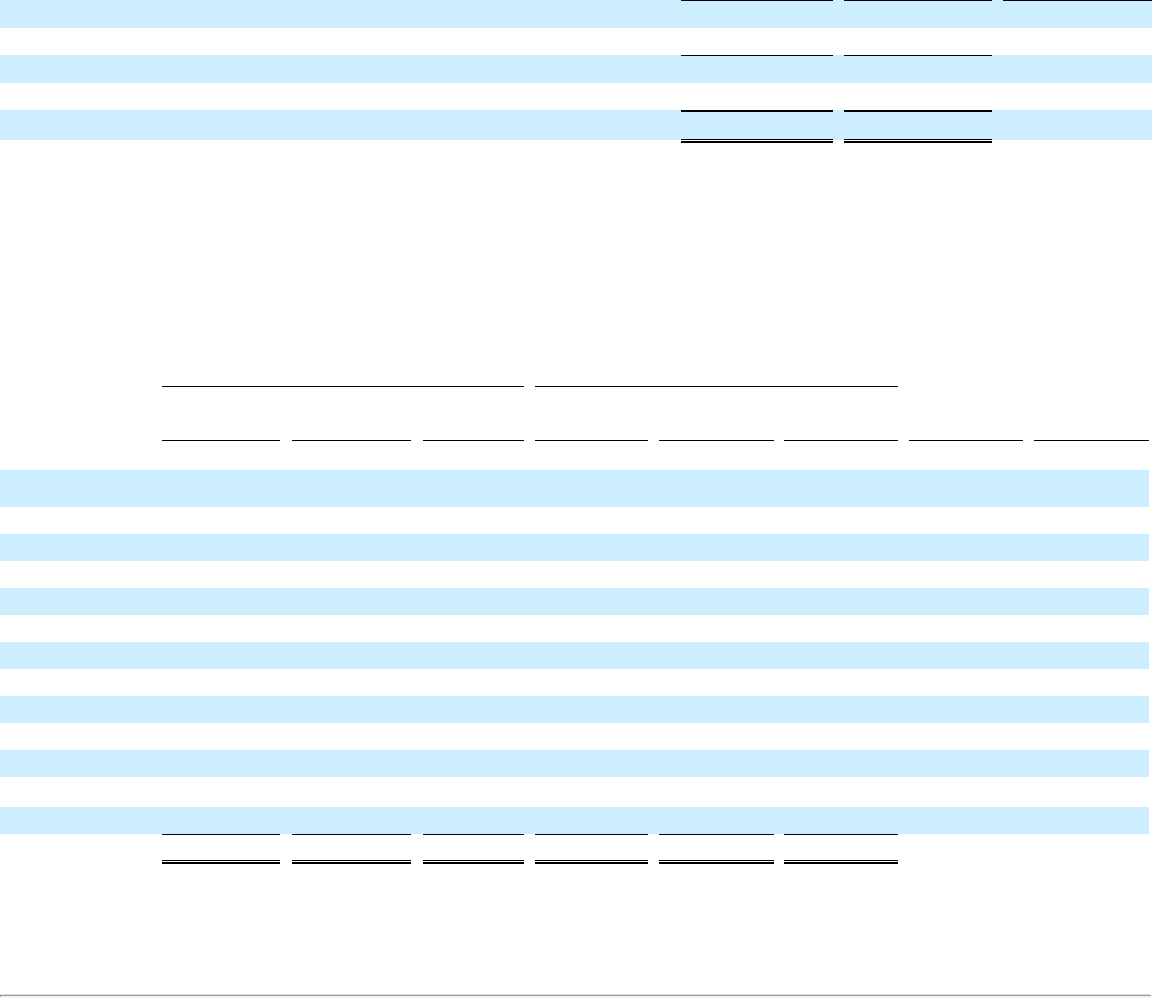
9. INTANGIBLE ASSETS AND GOODWILL
The Company's intangible assets at December 31, 2015 and 2014 consisted of the following (in thousands):
December 31, 2015
December 31, 2014
Gross Carrying
Amount
Accumulated
Amortization
Net Carrying
Amount
Gross Carrying
Amount
Accumulated
Amortization
Net Carrying
Amount
Amortization
Period
Weighted
Average Useful
Life
Supply and distribution
agreements $ 824,932
$(227,994)
$ 596,938
$ 842,642
$(188,441)
$ 654,201
10 - 20 years
16 years
Technology 112,639
(61,404)
51,235
108,987
(43,746)
65,241
1 - 5 years
5 years
Patents 1,623
(1,562)
61
1,623
(1,524)
99
15 years
15 years
Internet domain names 40,352
(20,954)
19,398
41,652
(16,895)
24,757
2 - 20 years
8 years
Trade names 1,671,356
(183,101)
1,488,255
1,674,218
(100,850)
1,573,368
4-20 years
20 years
Non-compete agreements 22,847
(11,201)
11,646
21,000
(3,908)
17,092
3-4 years
3 years
Other 135
(135)
—
141
(138)
3
Total intangible assets $ 2,673,884
$(506,351)
$ 2,167,533
$ 2,690,263
$(355,502)
$ 2,334,761
Intangible assets with determinable lives are amortized on a straight-line basis. Intangible assets amortization expense was approximately $171.0 million
, $129.6 million and $69.6 million for the years ended December 31, 2015 , 2014 and 2013 , respectively.
101