Priceline 2015 Annual Report Download - page 100
Download and view the complete annual report
Please find page 100 of the 2015 Priceline annual report below. You can navigate through the pages in the report by either clicking on the pages listed below, or by using the keyword search tool below to find specific information within the annual report.-
 1
1 -
2
-
3
-
4
-
5
-
6
-
7
-
8
-
9
-
10
-
11
-
12
-
13
-
14
-
15
-
16
-
17
-
18
-
19
-
20
-
21
-
22
-
23
-
24
-
25
-
26
-
27
-
28
-
29
-
30
-
31
-
32
-
33
-
34
-
35
-
36
-
37
-
38
-
39
-
40
-
41
-
42
-
43
-
44
-
45
-
46
-
47
-
48
-
49
-
50
-
51
-
52
-
53
-
54
-
55
-
56
-
57
-
58
-
59
-
60
-
61
-
62
-
63
-
64
-
65
-
66
-
67
-
68
-
69
-
70
-
71
-
72
-
73
-
74
-
75
-
76
-
77
-
78
-
79
-
80
-
81
-
82
-
83
-
84
-
85
-
86
-
87
-
88
-
89
-
 90
90 -
 91
91 -
 92
92 -
 93
93 -
 94
94 -
 95
95 -
 96
96 -
 97
97 -
 98
98 -
 99
99 -
 100
100 -
 101
101 -
 102
102 -
 103
103 -
 104
104 -
 105
105 -
 106
106 -
 107
107 -
 108
108 -
 109
109 -
 110
110 -
111
-
112
-
113
-
114
-
115
-
116
-
117
-
118
-
119
-
120
-
121
-
122
-
123
-
124
-
125
-
126
-
127
-
128
-
129
-
130
-
131
-
132
-
133
-
134
-
135
-
136
-
137
-
138
-
139
-
140
-
141
-
142
-
143
-
144
-
145
 |
 |

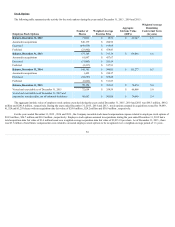
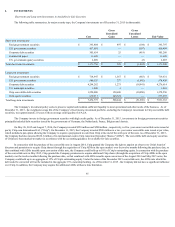
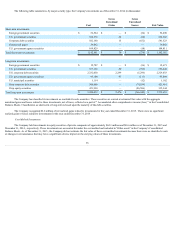
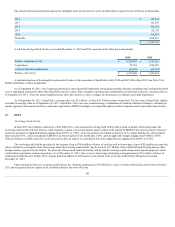
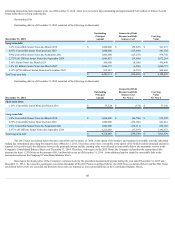
The following table summarizes, by major security type, the Company's investments as of December 31, 2014 (in thousands):
Cost
Gross
Unrealized
Gains
Gross
Unrealized
Losses
Fair Value
Short-term investments:
Foreign government securities $ 52,524
$ —
$ (34)
$ 52,490
U.S. government securities 364,276
24
(34)
364,266
Corporate debt securities 582,160
15
(652)
581,523
Commercial paper 39,092
—
—
39,092
U.S. government agency securities 104,829
—
(18)
104,811
Total short-term investments $ 1,142,881
$ 39
$ (738)
$ 1,142,182
Long-term investments:
Foreign government securities $ 12,707
$ —
$ (36)
$ 12,671
U.S. government securities 557,130
80
(762)
556,448
U.S. corporate debt securities 2,332,030
2,299
(5,296)
2,329,033
U.S. government agency securities 95,108
97
(111)
95,094
U.S. municipal securities 1,114
—
(12)
1,102
Ctrip corporate debt securities 500,000
—
(74,039)
425,961
Ctrip equity securities 421,930
—
(86,586)
335,344
Total long-term investments $ 3,920,019
$ 2,476
$ (166,842)
$ 3,755,653
The Company has classified its investments as available-for-sale securities. These securities are carried at estimated fair value with the aggregate
unrealized gains and losses related to these investments, net of taxes, reflected as a part of " Accumulated other comprehensive income (loss) " in the Consolidated
Balance Sheets. Classification as short-term or long-term is based upon the maturity of the debt securities.
The Company recognized $2.2 million of net realized gains related to investments for the year ended December 31, 2015 . There were no significant
realized gains or losses related to investments for the year ended December 31, 2014 .
Cost Method Investments
The Company held investments in equity securities of private companies of approximately $62.3 million and $0.6 million as of December 31, 2015 and
December 31, 2014 , respectively. These investments are accounted for under the cost method and included in "Other assets" in the Company's Consolidated
Balance Sheets. As of December 31, 2015 , the Company did not estimate the fair value of these cost-method investments because there were no identified events
or changes in circumstances that may have a significant adverse impact on the carrying values of these investments.
96