Priceline 2015 Annual Report Download - page 58
Download and view the complete annual report
Please find page 58 of the 2015 Priceline annual report below. You can navigate through the pages in the report by either clicking on the pages listed below, or by using the keyword search tool below to find specific information within the annual report.-
 1
1 -
2
-
3
-
4
-
5
-
6
-
7
-
8
-
9
-
10
-
11
-
12
-
13
-
14
-
15
-
16
-
17
-
18
-
19
-
20
-
21
-
22
-
23
-
24
-
25
-
26
-
27
-
28
-
29
-
30
-
31
-
32
-
33
-
34
-
35
-
36
-
37
-
38
-
39
-
40
-
41
-
42
-
43
-
44
-
45
-
46
-
47
-
 48
48 -
 49
49 -
 50
50 -
 51
51 -
 52
52 -
 53
53 -
 54
54 -
 55
55 -
 56
56 -
 57
57 -
 58
58 -
 59
59 -
 60
60 -
 61
61 -
 62
62 -
 63
63 -
 64
64 -
 65
65 -
 66
66 -
 67
67 -
 68
68 -
69
-
70
-
71
-
72
-
73
-
74
-
75
-
76
-
77
-
78
-
79
-
80
-
81
-
82
-
83
-
84
-
85
-
86
-
87
-
88
-
89
-
90
-
91
-
92
-
93
-
94
-
95
-
96
-
97
-
98
-
99
-
100
-
101
-
102
-
103
-
104
-
105
-
106
-
107
-
108
-
109
-
110
-
111
-
112
-
113
-
114
-
115
-
116
-
117
-
118
-
119
-
120
-
121
-
122
-
123
-
124
-
125
-
126
-
127
-
128
-
129
-
130
-
131
-
132
-
133
-
134
-
135
-
136
-
137
-
138
-
139
-
140
-
141
-
142
-
143
-
144
-
145
 |
 |

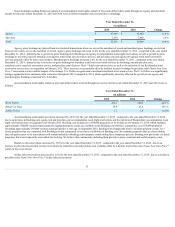
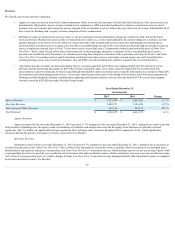
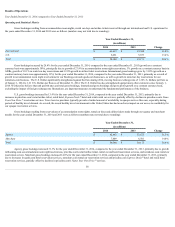
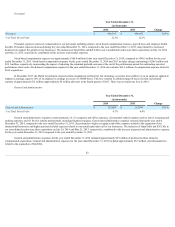
Personnel
Year Ended December 31,
(in thousands)
2015
2014
Change
Personnel $ 1,166,226
$ 950,191
22.7%
% of Total Gross Profit 13.6%
12.5%
Personnel expenses consist of compensation to our personnel, including salaries, stock-based compensation, bonuses, payroll taxes and employee health
benefits. Personnel expenses increased during the year ended December 31, 2015 , compared to the year ended December 31, 2014 , due primarily to increased
headcount to support the growth of our businesses. Additionally, the inclusion of a full year of OpenTable's results in our 2015 consolidated results as compared to
only a partial year's results in 2014 contributed to the increase in personnel expenses for the year ended December 31, 2015 compared to the year ended
December 31, 2014 .
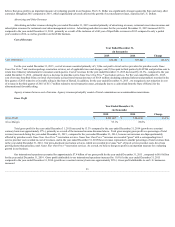
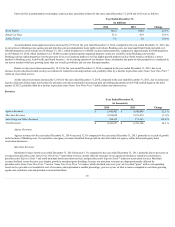
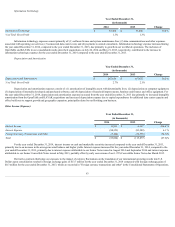
General and Administrative
Year Ended December 31,
(in thousands)
2015
2014
Change
General and Administrative $ 415,420
$ 352,869
17.7%
% of Total Gross Profit 4.8%
4.7%
General and administrative expenses consist primarily of: (1) occupancy and office expenses; (2) personnel-related expenses such as travel, recruiting and
training expenses; and (3) fees for outside professionals, including litigation expenses. General and administrative expenses increased during the year ended
December 31, 2015 , compared to the year ended December 31, 2014 , due to higher occupancy and office expenses related to the expansion of our international
businesses and higher personnel-related expenses related to increased headcount in all of our businesses. Additionally, the inclusion of a full year of OpenTable's
results in our 2015 consolidated results as compared to only a partial year's results in 2014 contributed to the increase in general and administrative expenses for
the year ended December 31, 2015 compared to the year ended December 31, 2014 .
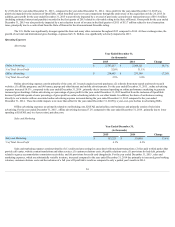
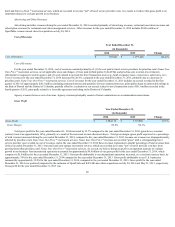
Information Technology
Year Ended December 31,
(in thousands)
2015
2014
Change
Information Technology $ 113,617
$ 97,498
16.5%
% of Total Gross Profit 1.3%
1.3%
Information technology expenses consist primarily of: (1) software license and system maintenance fees; (2) data communications and other expenses
associated with operating our services; (3) outsourced data center costs; and (4) payments to outside consultants. Information technology expense increased during
the year ended December 31, 2015 , compared to the year ended December 31, 2014 , due primarily to growth in our worldwide operations. Additionally, the
inclusion of a full year of OpenTable's results in our 2015 consolidated results as compared to only a partial year's results in 2014 contributed to the increase in
information technology expenses for the year ended December 31, 2015 compared to the year ended December 31, 2014 .
55