Priceline 2015 Annual Report Download - page 102
Download and view the complete annual report
Please find page 102 of the 2015 Priceline annual report below. You can navigate through the pages in the report by either clicking on the pages listed below, or by using the keyword search tool below to find specific information within the annual report.-
 1
1 -
2
-
3
-
4
-
5
-
6
-
7
-
8
-
9
-
10
-
11
-
12
-
13
-
14
-
15
-
16
-
17
-
18
-
19
-
20
-
21
-
22
-
23
-
24
-
25
-
26
-
27
-
28
-
29
-
30
-
31
-
32
-
33
-
34
-
35
-
36
-
37
-
38
-
39
-
40
-
41
-
42
-
43
-
44
-
45
-
46
-
47
-
48
-
49
-
50
-
51
-
52
-
53
-
54
-
55
-
56
-
57
-
58
-
59
-
60
-
61
-
62
-
63
-
64
-
65
-
66
-
67
-
68
-
69
-
70
-
71
-
72
-
73
-
74
-
75
-
76
-
77
-
78
-
79
-
80
-
81
-
82
-
83
-
84
-
85
-
86
-
87
-
88
-
89
-
90
-
91
-
 92
92 -
 93
93 -
 94
94 -
 95
95 -
 96
96 -
 97
97 -
 98
98 -
 99
99 -
 100
100 -
 101
101 -
 102
102 -
 103
103 -
 104
104 -
 105
105 -
 106
106 -
 107
107 -
 108
108 -
 109
109 -
 110
110 -
 111
111 -
 112
112 -
113
-
114
-
115
-
116
-
117
-
118
-
119
-
120
-
121
-
122
-
123
-
124
-
125
-
126
-
127
-
128
-
129
-
130
-
131
-
132
-
133
-
134
-
135
-
136
-
137
-
138
-
139
-
140
-
141
-
142
-
143
-
144
-
145
 |
 |

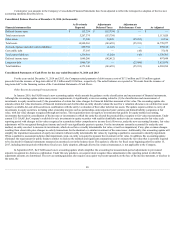
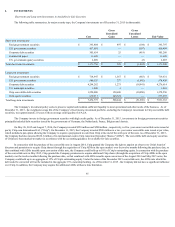
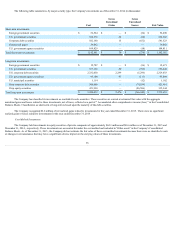
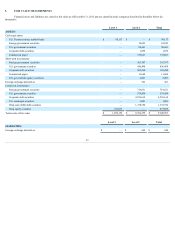
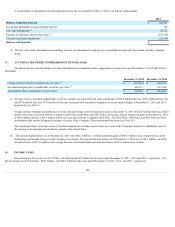
Financial assets and liabilities are carried at fair value as of December 31, 2014 and are classified in the categories described in the tables below (in
thousands):
Level 1
Level 2
Total
ASSETS:
Cash equivalents:
U.S. Treasury money market funds
$ 155,608
$ —
$ 155,608
Foreign government securities
—
974,855
974,855
U.S. government securities
—
676,503
676,503
Corporate debt securities
—
45,340
45,340
Commercial paper
—
382,544
382,544
U.S. government agency securities
—
10,000
10,000
Short-term investments:
Foreign government securities
—
52,490
52,490
U.S. government securities
—
364,266
364,266
Corporate debt securities
—
581,523
581,523
Commercial paper
—
39,092
39,092
U.S. government agency securities
—
104,811
104,811
Foreign exchange derivatives
—
336
336
Long-term investments:
Foreign government securities
—
12,671
12,671
U.S. government securities
—
556,448
556,448
Corporate debt securities
—
2,329,033
2,329,033
U.S. government agency securities
—
95,094
95,094
U.S. municipal securities
—
1,102
1,102
Ctrip convertible debt securities
—
425,961
425,961
Ctrip equity securities
335,344
—
335,344
Total assets at fair value
$ 490,952
$ 6,652,069
$ 7,143,021
Level 1
Level 2
Total
LIABILITIES:
Foreign exchange derivatives
$ —
$ 129
$ 129
There are three levels of inputs to measure fair value. The definition of each input is described below:
Level 1 : Quoted prices in active markets that are accessible by the Company at the measurement date for identical assets and liabilities.
Level 2 : Inputs are observable, either directly or indirectly. Such prices may be based upon quoted prices for identical or comparable securities
in active markets or inputs not quoted on active markets, but corroborated by market data.
Level 3 : Unobservable inputs are used when little or no market data is available.
Investments in corporate debt securities, U.S. and foreign government securities, commercial paper, government agency securities, convertible debt
securities and municipal securities are considered "Level 2 " valuations because the Company has access to quoted prices, but does not have visibility to the
volume and frequency of trading for all of these investments. For the Company's investments, a market approach is used for recurring fair value measurements and
the valuation techniques use inputs that are observable, or can be corroborated by observable data, in an active marketplace.
The Company's derivative instruments are valued using pricing models. Pricing models take into account the contract terms as well as multiple inputs
where applicable, such as interest rate yield curves, option volatility and currency rates.
98