Priceline 2015 Annual Report Download - page 41
Download and view the complete annual report
Please find page 41 of the 2015 Priceline annual report below. You can navigate through the pages in the report by either clicking on the pages listed below, or by using the keyword search tool below to find specific information within the annual report.-
 1
1 -
2
-
3
-
4
-
5
-
6
-
7
-
8
-
9
-
10
-
11
-
12
-
13
-
14
-
15
-
16
-
17
-
18
-
19
-
20
-
21
-
22
-
23
-
24
-
25
-
26
-
27
-
28
-
29
-
30
-
 31
31 -
 32
32 -
 33
33 -
 34
34 -
 35
35 -
 36
36 -
 37
37 -
 38
38 -
 39
39 -
 40
40 -
 41
41 -
 42
42 -
 43
43 -
 44
44 -
 45
45 -
 46
46 -
 47
47 -
 48
48 -
 49
49 -
 50
50 -
 51
51 -
52
-
53
-
54
-
55
-
56
-
57
-
58
-
59
-
60
-
61
-
62
-
63
-
64
-
65
-
66
-
67
-
68
-
69
-
70
-
71
-
72
-
73
-
74
-
75
-
76
-
77
-
78
-
79
-
80
-
81
-
82
-
83
-
84
-
85
-
86
-
87
-
88
-
89
-
90
-
91
-
92
-
93
-
94
-
95
-
96
-
97
-
98
-
99
-
100
-
101
-
102
-
103
-
104
-
105
-
106
-
107
-
108
-
109
-
110
-
111
-
112
-
113
-
114
-
115
-
116
-
117
-
118
-
119
-
120
-
121
-
122
-
123
-
124
-
125
-
126
-
127
-
128
-
129
-
130
-
131
-
132
-
133
-
134
-
135
-
136
-
137
-
138
-
139
-
140
-
141
-
142
-
143
-
144
-
145
 |
 |

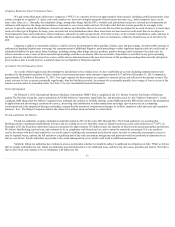
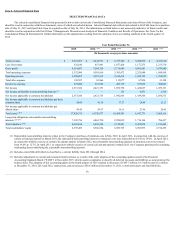
Item 6. Selected Financial Data
SELECTED FINANCIAL DATA
The selected consolidated financial data presented below is derived from the Consolidated Financial Statements and related Notes of the Company, and
should be read in connection with those statements, some of which are included herein. Selected financial data reflects data related to KAYAK from its acquisition
date of May 21, 2013 and OpenTable from its acquisition date of July 24, 2014. The information set forth below is not necessarily indicative of future results and
should be read in conjunction with Part II Item 7 Management's Discussion and Analysis of Financial Condition and Results of Operations. See Note 2 to the
Consolidated Financial Statements for further information on the adjustments resulting from the adoption of new accounting standards in the fourth quarter of
2015.
Year Ended December 31,
2015
2014 (3)(4)
2013 (3)(4)
2012 (3)(4)
2011 (3)(4)
(In thousands, except per share amounts)
Total revenues $ 9,223,987
$ 8,441,971
$ 6,793,306
$ 5,260,956
$ 4,355,610
Cost of revenues 632,180
857,841
1,077,420
1,177,275
1,275,730
Gross profit 8,591,807
7,584,130
5,715,886
4,083,681
3,079,880
Total operating expenses 5,332,900
4,510,818
3,303,472
2,253,888
1,680,958
Operating income 3,258,907
3,073,312
2,412,414
1,829,793
1,398,922
Total other expense 130,587
83,864
115,877
67,924
31,128
Income tax expense 576,960
567,695
403,739
337,832
308,663
Net income 2,551,360
2,421,753
1,892,798
1,424,037
1,059,131
Net income attributable to noncontrolling interests (1) —
—
135
4,471
2,760
Net income applicable to common stockholders 2,551,360
2,421,753
1,892,663
1,419,566
1,056,371
Net income applicable to common stockholders per basic
common share 50.09
46.30
37.17
28.48
21.27
Net income applicable to common stockholders per
diluted share 49.45
45.67
36.11
27.66
20.63
Total assets (3)(4) 17,420,575
14,770,977
10,428,543
6,547,771
3,964,165
Long-term obligations, redeemable noncontrolling
interests (2)(3)(4) 7,185,796
4,862,730
2,289,039
1,710,194
784,417
Total liabilities (3)(4) 8,625,106
6,203,954
3,510,281
2,435,854
1,185,465
Total stockholders' equity 8,795,469
8,566,694
6,909,729
3,896,975
2,574,295
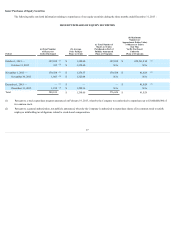
(1) Redeemable noncontrolling interests relates to the Company's purchase of rentalcars.com in May 2010. In April 2011, in connection with the exercise of
certain call and put options in March 2011, the redeemable noncontrolling interests in rentalcars.com were reduced from 24.4% to 19.0%. In April 2012,
in connection with the exercise of certain call and put options in March 2012, the redeemable noncontrolling interests in rentalcars.com were reduced
from 19.0% to 12.7%. In April 2013, in connection with the exercise of certain call and put options in March 2013, the Company purchased the remaining
outstanding shares underlying the redeemable noncontrolling interests.
(2) Includes convertible debt which is classified as a current liability from 2011 through 2014.
(3) Includes adjustments to current and noncurrent deferred taxes as a result of the early adoption of the accounting update issued by the Financial
Accounting Standards Board (“FASB”) in November 2015, which requires companies to classify all deferred tax assets and liabilities as noncurrent on the
balance sheet. The adoption of this accounting update in the fourth quarter of 2015 resulted in decreases of $143.7 million, $1.5 million and $1.2 million
at December 31, 2014, 2013 and 2012, respectively, and an increase of $0.6 million at December 31, 2011, in both total assets and total liabilities.
38