Priceline 2015 Annual Report Download - page 112
Download and view the complete annual report
Please find page 112 of the 2015 Priceline annual report below. You can navigate through the pages in the report by either clicking on the pages listed below, or by using the keyword search tool below to find specific information within the annual report.-
 1
1 -
2
-
3
-
4
-
5
-
6
-
7
-
8
-
9
-
10
-
11
-
12
-
13
-
14
-
15
-
16
-
17
-
18
-
19
-
20
-
21
-
22
-
23
-
24
-
25
-
26
-
27
-
28
-
29
-
30
-
31
-
32
-
33
-
34
-
35
-
36
-
37
-
38
-
39
-
40
-
41
-
42
-
43
-
44
-
45
-
46
-
47
-
48
-
49
-
50
-
51
-
52
-
53
-
54
-
55
-
56
-
57
-
58
-
59
-
60
-
61
-
62
-
63
-
64
-
65
-
66
-
67
-
68
-
69
-
70
-
71
-
72
-
73
-
74
-
75
-
76
-
77
-
78
-
79
-
80
-
81
-
82
-
83
-
84
-
85
-
86
-
87
-
88
-
89
-
90
-
91
-
92
-
93
-
94
-
95
-
96
-
97
-
98
-
99
-
100
-
101
-
 102
102 -
 103
103 -
 104
104 -
 105
105 -
 106
106 -
 107
107 -
 108
108 -
 109
109 -
 110
110 -
 111
111 -
 112
112 -
 113
113 -
 114
114 -
 115
115 -
 116
116 -
 117
117 -
 118
118 -
 119
119 -
 120
120 -
 121
121 -
 122
122 -
123
-
124
-
125
-
126
-
127
-
128
-
129
-
130
-
131
-
132
-
133
-
134
-
135
-
136
-
137
-
138
-
139
-
140
-
141
-
142
-
143
-
144
-
145
 |
 |

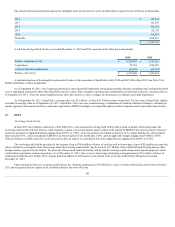
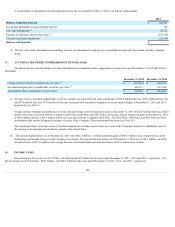
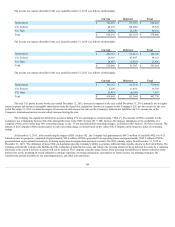
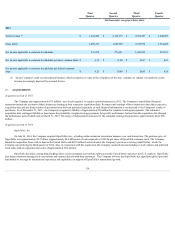
A reconciliation of redeemable noncontrolling interests for the year ended December 31, 2013 is as follows (in thousands):
2013
Balance, beginning of period $ 160,287
Net income attributable to noncontrolling interests 135
Fair value adjustments (1) 42,522
Purchase of subsidiary shares at fair value (1) (192,530)
Currency translation adjustments (10,414)
Balance, end of period $ —
(1) The fair value of the redeemable noncontrolling interests was determined by industry peer comparable analysis and a discounted cash flow valuation
model.
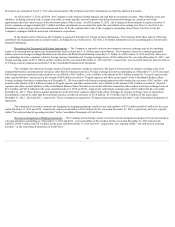
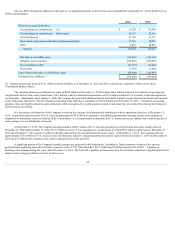
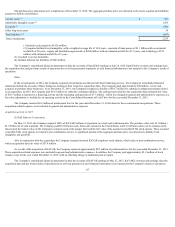
13 . ACCUMULATED OTHER COMPREHENSIVE INCOME (LOSS)
The table below provides the balances for each classification of accumulated other comprehensive income (loss) as of December 31, 2015 and 2014 (in
thousands):
December 31, 2015
December 31, 2014
Foreign currency translation adjustments, net of tax (1) $ (217,263)
$ (102,758)
Net unrealized gain (loss) on marketable securities, net of tax (2) 462,115
(157,144)
Accumulated other comprehensive income (loss) $ 244,852
$ (259,902)
(1) Foreign currency translation adjustments, net of tax, includes net losses from fair value adjustments of $34.8 million after tax ( $52.6 million before tax)
and $37.8 million after tax ( $57.8 million before tax) associated with derivatives designated as net investment hedges at December 31, 2015 and 2014 ,
respectively (see Note 5 ).
Foreign currency translation adjustments, net of tax, includes foreign currency transaction gains at December 31, 2015 of $126.8 million after tax ( $220.5
million before tax) associated with the Company's 2022 Notes, 2024 Notes and 2027 Notes and foreign currency transaction gains at December 31, 2014
of $48.3 million after tax ( $83.8 million before tax) associated with the Company's 2024 Notes. The 2022 Notes, 2024 Notes and 2027 Notes are Euro-
denominated debt and are designated as hedges of certain of the Company's Euro-denominated net assets (see Note 10 ).
The remaining balance in foreign currency translation adjustments excludes income taxes as a result of the Company's intention to indefinitely reinvest
the earnings of its international subsidiaries outside of the United States.
(2) The unrealized gains before tax at December 31, 2015 were $456.1 million , of which unrealized gains of $481.3 million were exempt from tax in the
Netherlands and unrealized losses of $25.2 million were taxable. The unrealized losses before tax at December 31, 2014 were $164.7 million , of which
unrealized losses of $134.6 million were exempt from tax in the Netherlands and unrealized losses of $30.1 million were taxable.
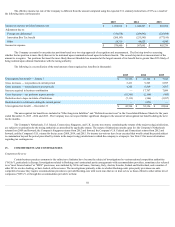
14 . INCOME TAXES
International pre-tax income was $3.1 billion , $2.9 billion and $2.2 billion for the years ended December 31, 2015 , 2014 and 2013 , respectively. U.S.
pre-tax income was $35.4 million , $98.4 million , and $48.5 million for the years ended December 31, 2015 , 2014 , and 2013 , respectively.
108