Priceline 2015 Annual Report Download - page 62
Download and view the complete annual report
Please find page 62 of the 2015 Priceline annual report below. You can navigate through the pages in the report by either clicking on the pages listed below, or by using the keyword search tool below to find specific information within the annual report.-
 1
1 -
2
-
3
-
4
-
5
-
6
-
7
-
8
-
9
-
10
-
11
-
12
-
13
-
14
-
15
-
16
-
17
-
18
-
19
-
20
-
21
-
22
-
23
-
24
-
25
-
26
-
27
-
28
-
29
-
30
-
31
-
32
-
33
-
34
-
35
-
36
-
37
-
38
-
39
-
40
-
41
-
42
-
43
-
44
-
45
-
46
-
47
-
48
-
49
-
50
-
51
-
 52
52 -
 53
53 -
 54
54 -
 55
55 -
 56
56 -
 57
57 -
 58
58 -
 59
59 -
 60
60 -
 61
61 -
 62
62 -
 63
63 -
 64
64 -
 65
65 -
 66
66 -
 67
67 -
 68
68 -
 69
69 -
 70
70 -
 71
71 -
 72
72 -
73
-
74
-
75
-
76
-
77
-
78
-
79
-
80
-
81
-
82
-
83
-
84
-
85
-
86
-
87
-
88
-
89
-
90
-
91
-
92
-
93
-
94
-
95
-
96
-
97
-
98
-
99
-
100
-
101
-
102
-
103
-
104
-
105
-
106
-
107
-
108
-
109
-
110
-
111
-
112
-
113
-
114
-
115
-
116
-
117
-
118
-
119
-
120
-
121
-
122
-
123
-
124
-
125
-
126
-
127
-
128
-
129
-
130
-
131
-
132
-
133
-
134
-
135
-
136
-
137
-
138
-
139
-
140
-
141
-
142
-
143
-
144
-
145
 |
 |

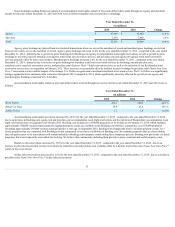
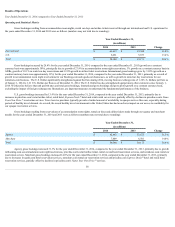
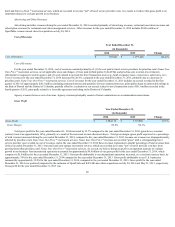
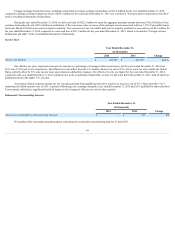
Units sold for accommodation room nights, rental car days and airline tickets for the years ended December 31, 2014 and 2013 were as follows:
Year Ended December 31,
(in millions)
2014
2013
Change
Room Nights 346.0
270.5
27.9%
Rental Car Days 51.8
43.9
18.1%
Airline Tickets 7.8
7.0
12.0%
Accommodation room night reservations increased by 27.9% for the year ended December 31, 2014, compared to the year ended December 31, 2013, due
to an increase in Booking.com, agoda.com and priceline.com accommodation room night reservations. Booking.com, our most significant brand, included over
600,000 properties on its website as of February 13, 2015, which included over 245,000 vacation rental properties, compared to approximately 425,000 properties
as of February 18, 2014, which included over 110,000 vacation rental properties (updated property counts are available on the Booking.com website).
Booking.com has added properties over the past year in its core European market as well as higher-growth markets such as North America (which is a newer
market for Booking.com), Asia-Pacific and South America. An increasing amount of our business from a destination and point-of-sale perspective is conducted in
our newer markets which are growing faster than our overall growth rate and our core European market.
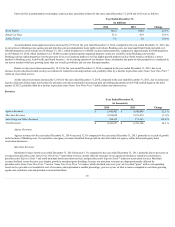
Rental car day reservations increased by 18.1% for the year ended December 31, 2014, compared to the year ended December 31, 2013, due to an
increase in price-disclosed rental car day reservations for rentalcars.com and priceline.com, partially offset by a decline in priceline.com's Name Your Own Price ®
rental car reservation service.
Airline ticket reservations increased by 12.0% for the year ended December 31, 2014, compared to the year ended December 31, 2013, due to an increase
in price-disclosed airline ticket reservations for priceline.com driven primarily by increased paid advertising placements on KAYAK (which began in the third
quarter of 2013), partially offset by a decline in priceline.com's Name Your Own Price ® airline ticket reservation service.
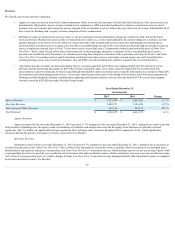
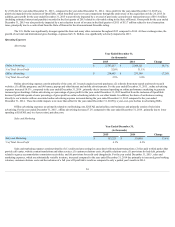
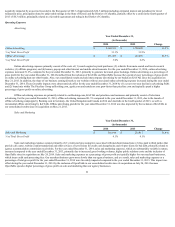
Revenues
Year Ended December 31,
(in thousands)
2014
2013
Change
Agency Revenues $ 5,845,802
$ 4,410,689
32.5 %
Merchant Revenues 2,186,054
2,211,474
(1.1)%
Advertising and Other Revenues 410,115
171,143
139.6 %
Total Revenues $ 8,441,971
$ 6,793,306
24.3 %
Agency Revenues
Agency revenues for the year ended December 31, 2014 increased 32.5% compared to the year ended December 31, 2013, primarily as a result of growth
in the business of Booking.com. Our priceline.com agency revenues benefited from growth in our retail rental car, agency airline ticket and agency hotel
reservation businesses.
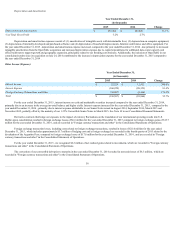
Merchant Revenues
Merchant revenues for the year ended December 31, 2014 decreased 1.1% compared to the year ended December 31, 2013, primarily due to decreases in
revenues from priceline.com's Name Your Own Price ® reservation services, mostly offset by increases in our agoda.com business, rentalcars.com business,
priceline.com's Express Deals ® and retail merchant hotel reservation services and priceline.com's Express Deals ® rental car reservation services. Merchant
revenue declined versus the prior year despite growth in merchant gross bookings, because our merchant revenues are disproportionately affected by
priceline.com's Name Your Own Price ® service. Name Your Own Price ® revenues, which declined year-over-year, are recorded "gross" with a corresponding
travel service provider cost recorded in cost of revenues, and represented a smaller percentage, year-over-year, of total revenues compared to our faster-growing
agoda.com, rentalcars.com and priceline.com retail merchant
59