PG&E 2011 Annual Report Download - page 99
Download and view the complete annual report
Please find page 99 of the 2011 PG&E annual report below. You can navigate through the pages in the report by either clicking on the pages listed below, or by using the keyword search tool below to find specific information within the annual report.-
 1
1 -
2
-
3
-
4
-
5
-
6
-
7
-
8
-
9
-
10
-
11
-
12
-
13
-
14
-
15
-
16
-
17
-
18
-
19
-
20
-
21
-
22
-
23
-
24
-
25
-
26
-
27
-
28
-
29
-
30
-
31
-
32
-
33
-
34
-
35
-
36
-
37
-
38
-
39
-
40
-
41
-
42
-
43
-
44
-
45
-
46
-
47
-
48
-
49
-
50
-
51
-
52
-
53
-
54
-
55
-
56
-
57
-
58
-
59
-
60
-
61
-
62
-
63
-
64
-
65
-
66
-
67
-
68
-
69
-
70
-
71
-
72
-
73
-
74
-
75
-
76
-
77
-
78
-
79
-
80
-
81
-
82
-
83
-
84
-
85
-
86
-
87
-
88
-
 89
89 -
 90
90 -
 91
91 -
 92
92 -
 93
93 -
 94
94 -
 95
95 -
 96
96 -
 97
97 -
 98
98 -
 99
99 -
 100
100 -
 101
101 -
 102
102 -
 103
103 -
 104
104 -
 105
105 -
 106
106 -
 107
107 -
 108
108 -
 109
109 -
110
-
111
-
112
-
113
-
114
-
115
-
116
-
117
-
118
-
119
-
120
-
121
-
122
-
123
-
124
-
125
-
126
-
127
-
128
 |
 |

NOTE 12: EMPLOYEE BENEFIT PLANS (Continued)
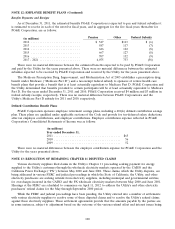
The estimated amounts that will be amortized into net periodic benefit cost for PG&E Corporation in 2012 are
as follows:
Pension Benefits
(in millions)
Unrecognized prior service cost ................. $ 19
Unrecognized net loss ........................ 125
Total ................................... $144
Other Benefits
(in millions)
Unrecognized prior service cost .................. $25
Unrecognized net loss ......................... 6
Unrecognized net transition obligation ............. 24
Total .................................... $55
There were no material differences between the estimated amounts that will be amortized into net period
benefit costs for PG&E Corporation and the Utility.
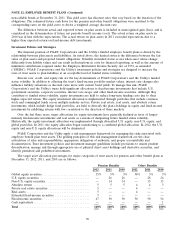
Valuation Assumptions
The following actuarial assumptions were used in determining the projected benefit obligations and the net
periodic cost. The following weighted average year-end assumptions were used in determining the plans’ projected
benefit obligations and net benefit cost.
Pension Benefits Other Benefits
December 31, December 31,
2011 2010 2009 2011 2010 2009
Discount rate ............. 4.66% 5.42% 5.97% 4.41 - 4.77% 5.11 - 5.56% 5.66 - 6.09%
Average rate of future
compensation increases .... 5.00% 5.00% 5.00% ———
Expected return on plan
assets ................. 5.50% 6.60% 6.80% 4.40 - 5.50% 5.20 - 6.60% 5.80 - 6.90%
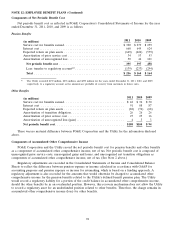
The assumed health care cost trend rate as of December 31, 2011 is 8%, decreasing gradually to an ultimate
trend rate in 2018 and beyond of approximately 5%. A one-percentage-point change in assumed health care cost
trend rate would have the following effects:
One- One-
Percentage- Percentage-
Point Point
Increase Decrease
(in millions)
Effect on postretirement benefit obligation .................... $95 $(98)
Effect on service and interest cost ........................... 7 (8)
Expected rates of return on plan assets were developed by determining projected stock and bond returns and
then applying these returns to the target asset allocations of the employee benefit plan trusts, resulting in a weighted
average rate of return on plan assets. Returns on fixed-income debt investments were projected based on real
maturity and credit spreads added to a long-term inflation rate. Returns on equity investments were estimated based
on estimates of dividend yield and real earnings growth added to a long-term inflation rate. For the pension plan, the
assumed return of 5.5% compares to a ten-year actual return of 7.6%. The rate used to discount pension benefits
and other benefits was based on a yield curve developed from market data of over approximately 530 Aa-grade
95