PG&E 2011 Annual Report Download - page 103
Download and view the complete annual report
Please find page 103 of the 2011 PG&E annual report below. You can navigate through the pages in the report by either clicking on the pages listed below, or by using the keyword search tool below to find specific information within the annual report.-
 1
1 -
2
-
3
-
4
-
5
-
6
-
7
-
8
-
9
-
10
-
11
-
12
-
13
-
14
-
15
-
16
-
17
-
18
-
19
-
20
-
21
-
22
-
23
-
24
-
25
-
26
-
27
-
28
-
29
-
30
-
31
-
32
-
33
-
34
-
35
-
36
-
37
-
38
-
39
-
40
-
41
-
42
-
43
-
44
-
45
-
46
-
47
-
48
-
49
-
50
-
51
-
52
-
53
-
54
-
55
-
56
-
57
-
58
-
59
-
60
-
61
-
62
-
63
-
64
-
65
-
66
-
67
-
68
-
69
-
70
-
71
-
72
-
73
-
74
-
75
-
76
-
77
-
78
-
79
-
80
-
81
-
82
-
83
-
84
-
85
-
86
-
87
-
88
-
89
-
90
-
91
-
92
-
 93
93 -
 94
94 -
 95
95 -
 96
96 -
 97
97 -
 98
98 -
 99
99 -
 100
100 -
 101
101 -
 102
102 -
 103
103 -
 104
104 -
 105
105 -
 106
106 -
 107
107 -
 108
108 -
 109
109 -
 110
110 -
 111
111 -
 112
112 -
 113
113 -
114
-
115
-
116
-
117
-
118
-
119
-
120
-
121
-
122
-
123
-
124
-
125
-
126
-
127
-
128
 |
 |

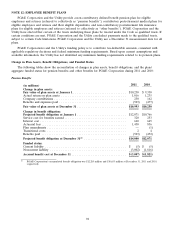
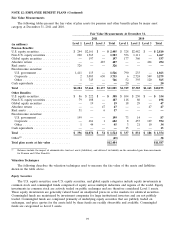
NOTE 12: EMPLOYEE BENEFIT PLANS (Continued)
Level 3 Reconciliation
The following table is a reconciliation of changes in the fair value of instruments for pension and other benefit
plans that have been classified as Level 3 for the years ended December 31, 2011 and 2010:
Pension Benefits Other Benefits
Corporate Other Corporate Other
Absolute fixed- fixed- Absolute fixed- fixed- Real
return income income Total return income income assets Total
(in millions)
Balance as of January 1, 2010 . . $340 $531 $190 $1,061 $32 $124 $17 $ — $ 173
Actual return on plan assets:
Relating to assets still held at
the reporting date ....... 44 52 5 101 415—— 19
Relating to assets sold during
the period ............. 5 5 5 15 1(2)—— (1)
Purchases, issuances, sales, and
settlements .............. 105 (39) (80) (14) 10 (8) (7) —(5)
Balance as of December 31,
2010 ................... $494 $549 $120 $1,163 $47 $129 $10 $ — $ 186
Actual return on plan assets:
Relating to assets still held at
the reporting date ....... 5 57 (2) 60 116—— 17
Relating to assets sold during
the period ............. 2 — 1 3—(2) —— (2)
Purchases, issuances, sales, and
settlements
Purchases ............... — 79 2 81 — 34 — 6 40
Settlements .............. (14) (35) (58) (107) (1) (30) (5) —(36)
Transfers out of Level 3 ...... ——(63) (63) —(146) (5) —(151)
Balance as of December 31,
2011 ................... $487 $650 $ — $1,137 $47 $ 1 $— $ 6 $ 54
Cash Flow Information
Employer Contributions
PG&E Corporation and the Utility contributed $230 million to the pension benefit plans and $137 million to the
other benefit plans in 2011. These contributions are consistent with PG&E Corporation’s and the Utility’s funding
policy, which is to contribute amounts that are tax-deductible and consistent with applicable regulatory decisions and
federal minimum funding requirements. None of these pension or other benefits were subject to a minimum funding
requirement requiring a cash contribution in 2011. The Utility’s pension benefits met all the funding requirements
under ERISA. PG&E Corporation and the Utility expect to make total contributions of approximately $286 million
and $109 million to the pension plan and other postretirement benefit plans, respectively, for 2012.
99