PG&E 2011 Annual Report Download - page 60
Download and view the complete annual report
Please find page 60 of the 2011 PG&E annual report below. You can navigate through the pages in the report by either clicking on the pages listed below, or by using the keyword search tool below to find specific information within the annual report.-
 1
1 -
2
-
3
-
4
-
5
-
6
-
7
-
8
-
9
-
10
-
11
-
12
-
13
-
14
-
15
-
16
-
17
-
18
-
19
-
20
-
21
-
22
-
23
-
24
-
25
-
26
-
27
-
28
-
29
-
30
-
31
-
32
-
33
-
34
-
35
-
36
-
37
-
38
-
39
-
40
-
41
-
42
-
43
-
44
-
45
-
46
-
47
-
48
-
49
-
 50
50 -
 51
51 -
 52
52 -
 53
53 -
 54
54 -
 55
55 -
 56
56 -
 57
57 -
 58
58 -
 59
59 -
 60
60 -
 61
61 -
 62
62 -
 63
63 -
 64
64 -
 65
65 -
 66
66 -
 67
67 -
 68
68 -
 69
69 -
 70
70 -
71
-
72
-
73
-
74
-
75
-
76
-
77
-
78
-
79
-
80
-
81
-
82
-
83
-
84
-
85
-
86
-
87
-
88
-
89
-
90
-
91
-
92
-
93
-
94
-
95
-
96
-
97
-
98
-
99
-
100
-
101
-
102
-
103
-
104
-
105
-
106
-
107
-
108
-
109
-
110
-
111
-
112
-
113
-
114
-
115
-
116
-
117
-
118
-
119
-
120
-
121
-
122
-
123
-
124
-
125
-
126
-
127
-
128
 |
 |

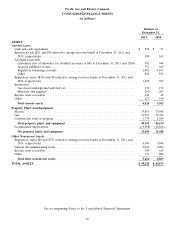
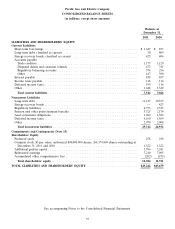
Pacific Gas and Electric Company
CONSOLIDATED BALANCE SHEETS
(in millions)
Balance at
December 31,
2011 2010
ASSETS
Current Assets
Cash and cash equivalents ................................................. $ 304 $ 51
Restricted cash ($51 and $38 related to energy recovery bonds at December 31, 2011 and
2010, respectively) ..................................................... 380 563
Accounts receivable
Customers (net of allowance for doubtful accounts of $81 at December 31, 2011 and 2010) 992 944
Accrued unbilled revenue ................................................ 763 649
Regulatory balancing accounts ............................................ 1,082 1,105
Other .............................................................. 840 856
Regulatory assets ($336 and $0 related to energy recovery bonds at December 31, 2011 and
2010, respectively) ..................................................... 1,090 599
Inventories
Gas stored underground and fuel oil ........................................ 159 152
Materials and supplies .................................................. 261 205
Income taxes receivable ................................................... 242 48
Other ................................................................ 213 190
Total current assets .................................................... 6,326 5,362
Property, Plant, and Equipment
Electric .............................................................. 35,851 33,508
Gas ................................................................. 11,931 11,382
Construction work in progress .............................................. 1,770 1,384
Total property, plant, and equipment ....................................... 49,552 46,274
Accumulated depreciation ................................................. (15,898) (14,826)
Net property, plant, and equipment ......................................... 33,654 31,448
Other Noncurrent Assets
Regulatory assets ($0 and $735 related to energy recovery bonds at December 31, 2011 and
2010, respectively) ..................................................... 6,506 5,846
Nuclear decommissioning trusts ............................................. 2,041 2,009
Income taxes receivable ................................................... 384 614
Other ................................................................ 331 400
Total other noncurrent assets ............................................. 9,262 8,869
TOTAL ASSETS ......................................................... $ 49,242 $ 45,679
See accompanying Notes to the Consolidated Financial Statements.
56