PG&E 2011 Annual Report Download - page 100
Download and view the complete annual report
Please find page 100 of the 2011 PG&E annual report below. You can navigate through the pages in the report by either clicking on the pages listed below, or by using the keyword search tool below to find specific information within the annual report.-
 1
1 -
2
-
3
-
4
-
5
-
6
-
7
-
8
-
9
-
10
-
11
-
12
-
13
-
14
-
15
-
16
-
17
-
18
-
19
-
20
-
21
-
22
-
23
-
24
-
25
-
26
-
27
-
28
-
29
-
30
-
31
-
32
-
33
-
34
-
35
-
36
-
37
-
38
-
39
-
40
-
41
-
42
-
43
-
44
-
45
-
46
-
47
-
48
-
49
-
50
-
51
-
52
-
53
-
54
-
55
-
56
-
57
-
58
-
59
-
60
-
61
-
62
-
63
-
64
-
65
-
66
-
67
-
68
-
69
-
70
-
71
-
72
-
73
-
74
-
75
-
76
-
77
-
78
-
79
-
80
-
81
-
82
-
83
-
84
-
85
-
86
-
87
-
88
-
89
-
 90
90 -
 91
91 -
 92
92 -
 93
93 -
 94
94 -
 95
95 -
 96
96 -
 97
97 -
 98
98 -
 99
99 -
 100
100 -
 101
101 -
 102
102 -
 103
103 -
 104
104 -
 105
105 -
 106
106 -
 107
107 -
 108
108 -
 109
109 -
 110
110 -
111
-
112
-
113
-
114
-
115
-
116
-
117
-
118
-
119
-
120
-
121
-
122
-
123
-
124
-
125
-
126
-
127
-
128
 |
 |

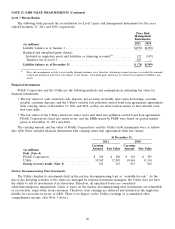
NOTE 12: EMPLOYEE BENEFIT PLANS (Continued)
non-callable bonds at December 31, 2011. This yield curve has discount rates that vary based on the duration of the
obligations. The estimated future cash flows for the pension and other benefit obligations were matched to the
corresponding rates on the yield curve to derive a weighted average discount rate.
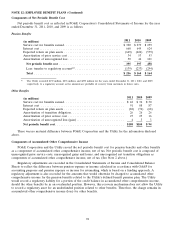
The difference between actual and expected return on plan assets is included in unrecognized gain (loss), and is
considered in the determination of future net periodic benefit income (cost). The actual return on plan assets in
2010 was in line with the expectations. The actual return on plan assets in 2011 exceeded expectations due to a
higher than expected return on fixed-income debt investments.
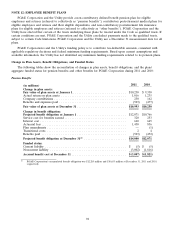
Investment Policies and Strategies
The financial position of PG&E Corporation’s and the Utility’s funded employee benefit plans is driven by the
relationship between plan assets and liabilities. As noted above, the funded status is the difference between the fair
value of plan assets and projected benefit obligations. Volatility in funded status occurs when asset values change
differently from liability values and can result in fluctuations in costs for financial reporting, as well as the amount of
minimum contributions required under the Employee Retirement Income Security Act of 1974, as amended
(‘‘ERISA’’). PG&E Corporation’s and the Utility’s investment policies and strategies are designed to increase the
ratio of trust assets to plan liabilities at an acceptable level of funded status volatility.
Interest rate, credit, and equity risk are the key determinants of PG&E Corporation’s and the Utility’s funded
status volatility. In addition to affecting the trust’s fixed-income portfolio market values, interest rate changes also
influence liability valuations as discount rates move with current bond yields. To manage this risk, PG&E
Corporation’s and the Utility’s trusts hold significant allocations to fixed-income investments that include U.S.
government securities, corporate securities, interest rate swaps, and other fixed-income securities. Although they
contribute to funded status volatility, equity investments are held to reduce long-term funding costs due to their
higher expected return. The equity investment allocation is implemented through portfolios that include common
stock and commingled funds across multiple industry sectors. Private real estate, real assets, and absolute return
investments, which include hedge fund portfolios, are held to diversify the plan’s holdings in equity and fixed-income
investments by exhibiting returns with low correlation to the direction of these markets.
Over the last three years, target allocations for equity investments have generally declined in favor of longer-
maturity fixed-income investments and real assets as a means of dampening future funded status volatility.
Historically, the equity investment allocation was implemented through diversified U.S. equity, non-U.S. equity, and
global portfolios. In 2011, the equity allocation began transitioning to a combined global allocation. In 2012, the U.S.
equity and non-U.S. equity allocations will be eliminated.
PG&E Corporation and the Utility apply a risk management framework for managing the risks associated with
employee benefit plan trust assets. The guiding principles of this risk management framework are the clear
articulation of roles and responsibilities, appropriate delegation of authority, and proper accountability and
documentation. Trust investment policies and investment manager guidelines include provisions to ensure prudent
diversification, manage risk through appropriate use of physical direct asset holdings and derivative securities, and
identify permitted and prohibited investments.
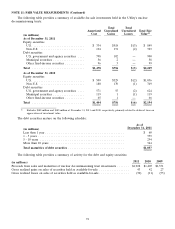
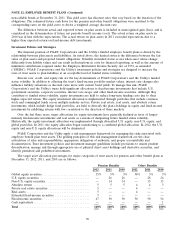
The target asset allocation percentages for major categories of trust assets for pension and other benefit plans at
December 31, 2012, 2011, and 2010 are as follows:
Pension Benefits Other Benefits
2012 2011 2010 2012 2011 2010
Global equity securities ........................... 35% 5% 5% 38% 3% 3%
U.S. equity securities ............................ — 26 26 — 28 26
Non-U.S. equity securities ......................... — 14 14 — 15 13
Absolute return ................................ 555443
Private real estate securities ....................... 5 —— 4——
Real assets .................................... 5 —— 4——
Extended fixed-income securities .................... 3 —————
Fixed-income securities ........................... 47 50 50 50 50 54
Cash equivalents ................................ ————— 1
Total ........................................ 100% 100% 100% 100% 100% 100%
96